Courses in Linnaeus University : Information Visualization
During my exchange semester in Linnaeus University, I’ve had 5 different courses. I’ve particularly liked one of them, so I’ve decided to make a blog post about it, my most favorite course : Information Visualization.
In this course, we had the very basic goal of learning a lot about the different ways to visualize different kinds of information and being able in the end to think about our own representations.
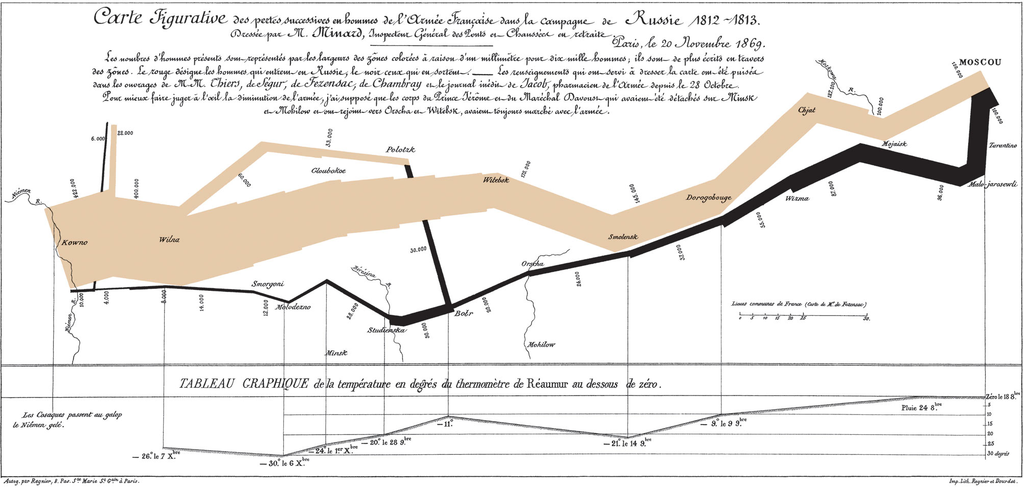
Information visualization can take a very wide range of possibilities and there can be tons of visualizations for a single group of data. The example below shows perfectly the complexity an information display can take.

In the above’s map, Charles Minard represented the disastrous Russian invade campaign using six different types of data : the number of Napoleon’s troops, distance, temperature, the latitude and longitude, direction of travel, and location relative to specific dates. He indeed represented all these information in a very original way that might look at first a little bit hard to understand, but once we start to understand a little the map, we can get really quickly the picture out of it.
During this course, we have seen a lot of different visualization techniques like preattentive processing, data transformation using dynamic queries with for example range sliders, view transformations using user interaction with for example zoom and pan, just to cite a few.
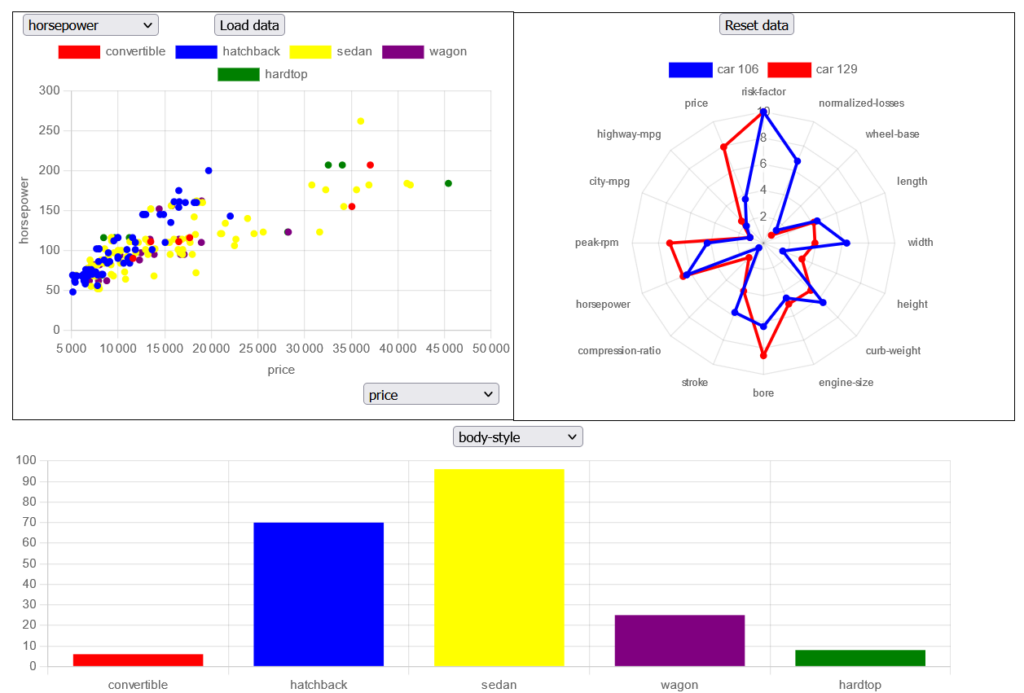
At the end of the course, we had to make our own visualization of a specific set of data about cars and their characteristics. Mine was the following :

As we had a lot of different characteristics for each car (26 features in total), I decided to display them using three different types of chart. At first a point chart, then a bar plot and finally a star plot.
The point chart is used to display and compare every cars using the numeric data. It is possible to change the features we are comparing them with using the simple select tools.
The bar plot is used to compare the types of cars and putting them in groups using text data in a way we can easily find what type of car is a specific point on the first chart with the use of colors.
The star plot is used to display every information of a specific car after clicking on it on the point chart. So for example if we feel interested in a car because it looks cheap with a high horsepower, we can also see easily its other statistics in the star plot so we can make up our mind about it. We also can use it to compare a car to others by adding more cars on the plot.
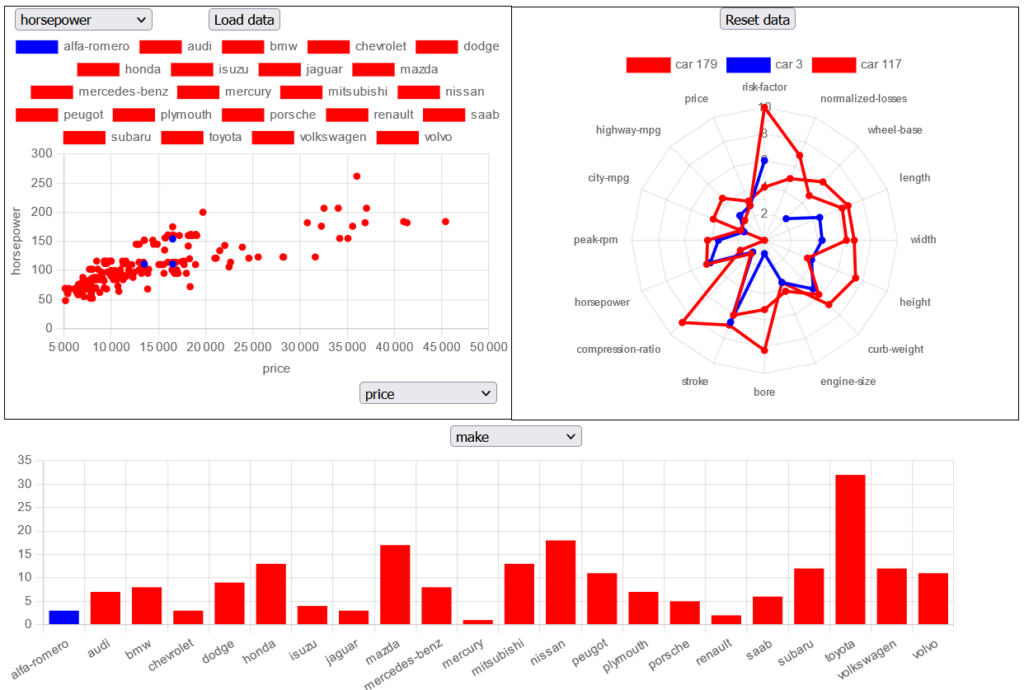
Another important feature of my visualization was preattentive processing. Preattentive processing is what allows us to distinguish data quickly (between 50 and 500ms) thanks to a difference of representation. One of the fastest preattentive processing is when you for example decide to put a blue point on a point chart full of red points. This way, your brain will identify in a very short time the blue point, so it basically makes it easier to find specific information.
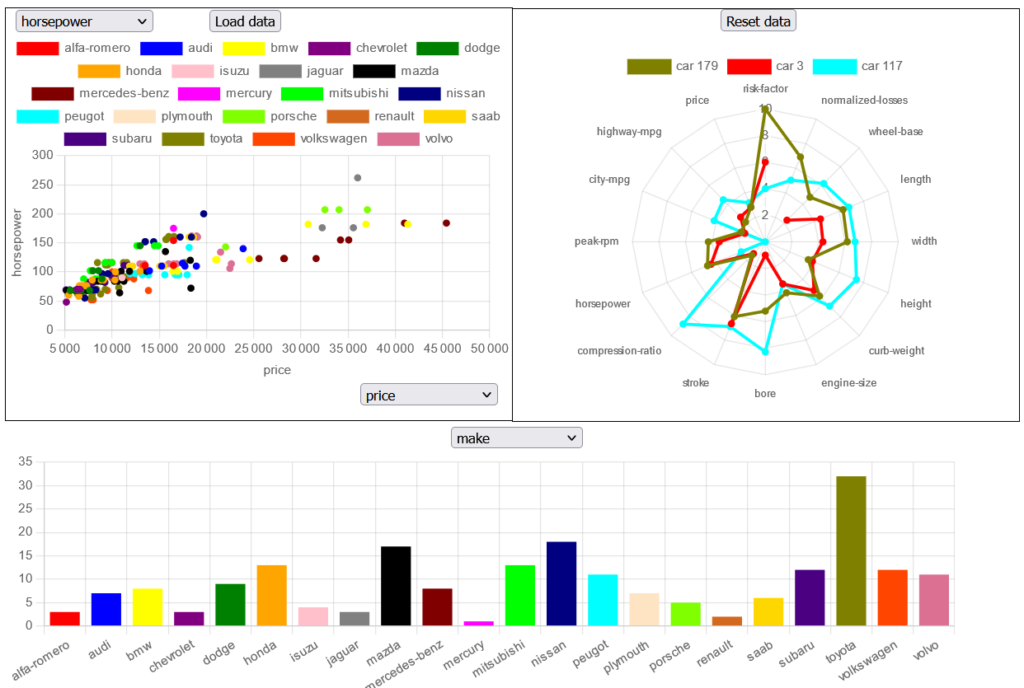
To add this on my visualization, it is as simple as clicking on a car type in the bar plot. It will then turn all the car’s point colors in red except for the type clicked on which will be then blue. This way, the user can easily identify where are all the cars with a specific feature (here, car maker : Alfa Romeo). It can be very useful when there are too many car types like in the following example with the car makers.


I personally liked a lot this course. It was very interesting to learn about all these techniques and it was the one with the most real-life use-cases as it is a course mainly focused on design which is basically everywhere in our lives, with a focus here on information visualization.