Archives de
Category: Échanges internationaux

My Japanese learning experience in Nihon University (日本大学)

My Japanese learning experience in Nihon University (日本大学)

After my exchange semester in Sweden, I’ve directly taken the plane for another exchange semester, but this time way further to… Japan ! So from now on, I’m going to speak about this exchange semester, my experience in Tokyo and a few surroundings !
Let’s start today with what was the main goal of my semester in Japan : learning Japanese !

Main courses

During the Japanese learning, there were two types of courses, what I would call « main courses » which are Japanese language focused, and then cultural courses with a very wide range of subjects, about Japan and its culture.

Main courses were every morning from 9:00 to 12:10. These courses were very complete and thanks to them I could learn a lot on every aspects of the language, from grammar to kanji drawing, listening, writing…
Before coming to Japan, I learnt a little Japanese by myself and because I was always listening to Japanese songs and watching a lot of Japanese content, I knew already a lot of vocabulary and could make basic sentences and have conversations during everyday life. I managed for example to have a quite long conversation with a lady in the airplane going to Japan. It was a very funny moment, I have great memories of it, me trying for the first time to have a good conversation with a Japanese person, in Japanese.

Grammar being the aspect of the language I had the more struggles with in the beginning, I quickly realized how fast I made up for the gap with these courses and I could quickly made more complex sentences. I was also very bad at writing because I never had a good opportunity to practice in France, but again, with a good effort, it was possible to quickly learn the most important kanji that I should have already known according to my level.

Cultural courses

These courses which were focused on way broader things about Japan and its culture were every afternoon, from Monday to Thursday.

On Mondays, we had courses with a new teacher every 2 weeks, focusing on different subjects, economy, musics, the main issues of the country and how Japan could try to solve them, how do Japanese people communicate and the differences with our countries. These courses were all very interesting, with my favorite being the one about Japanese musics and its evolution through years (and also centuries), probably because it’s the Japan-related thing I like to talk about the most.

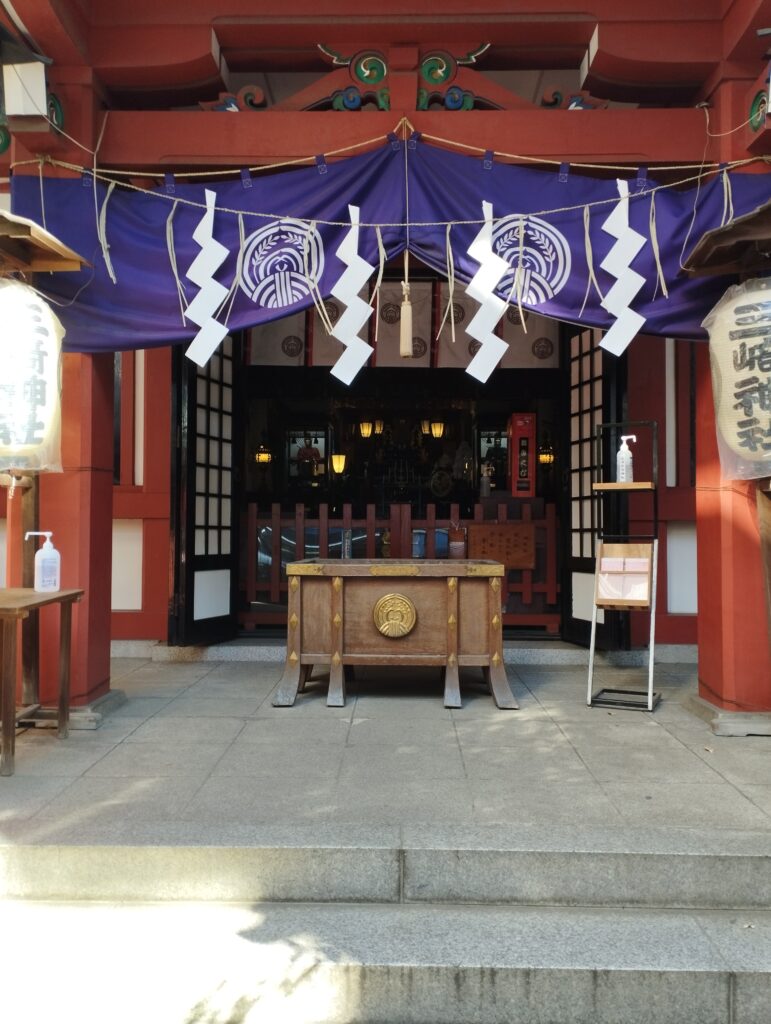
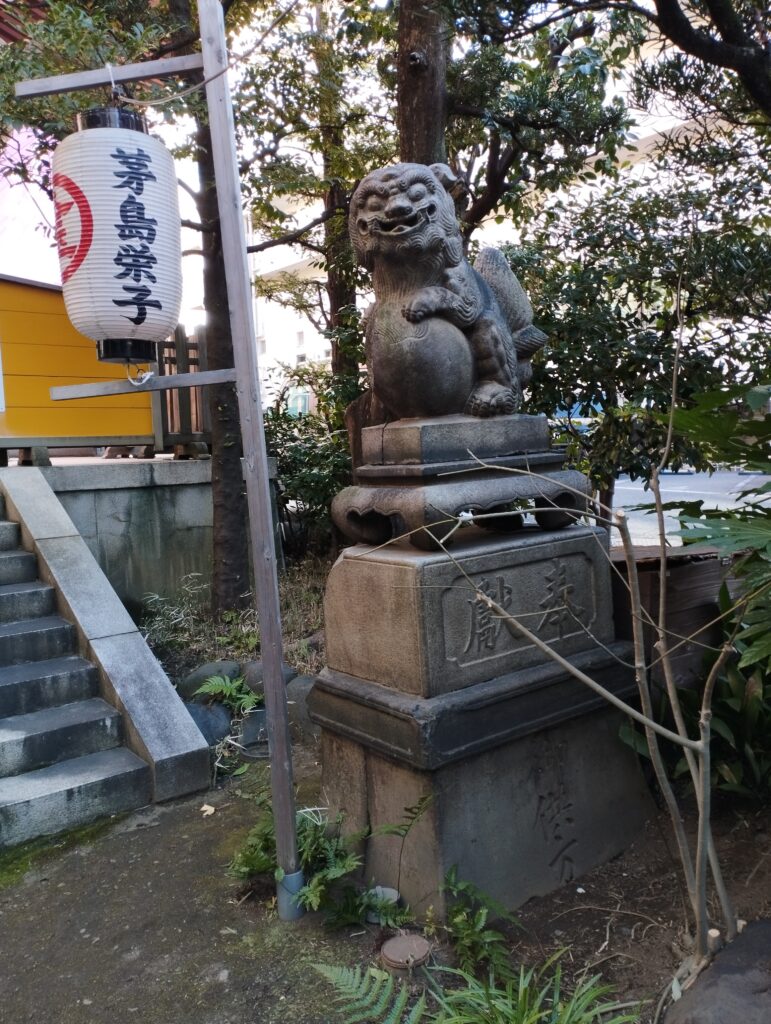
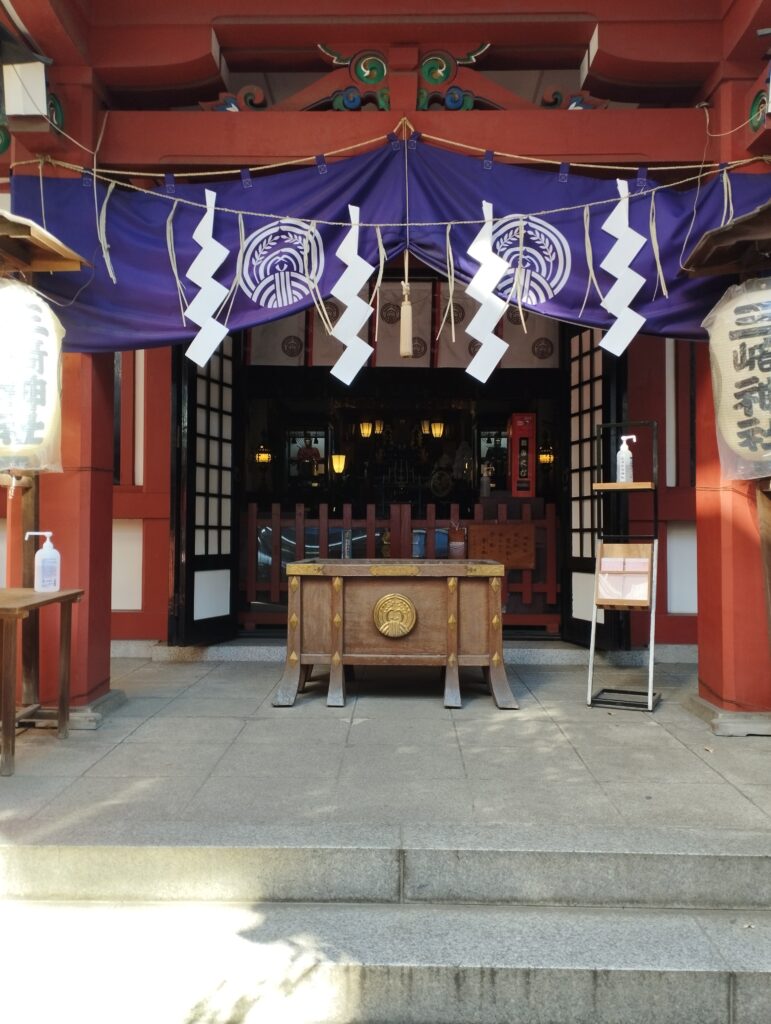
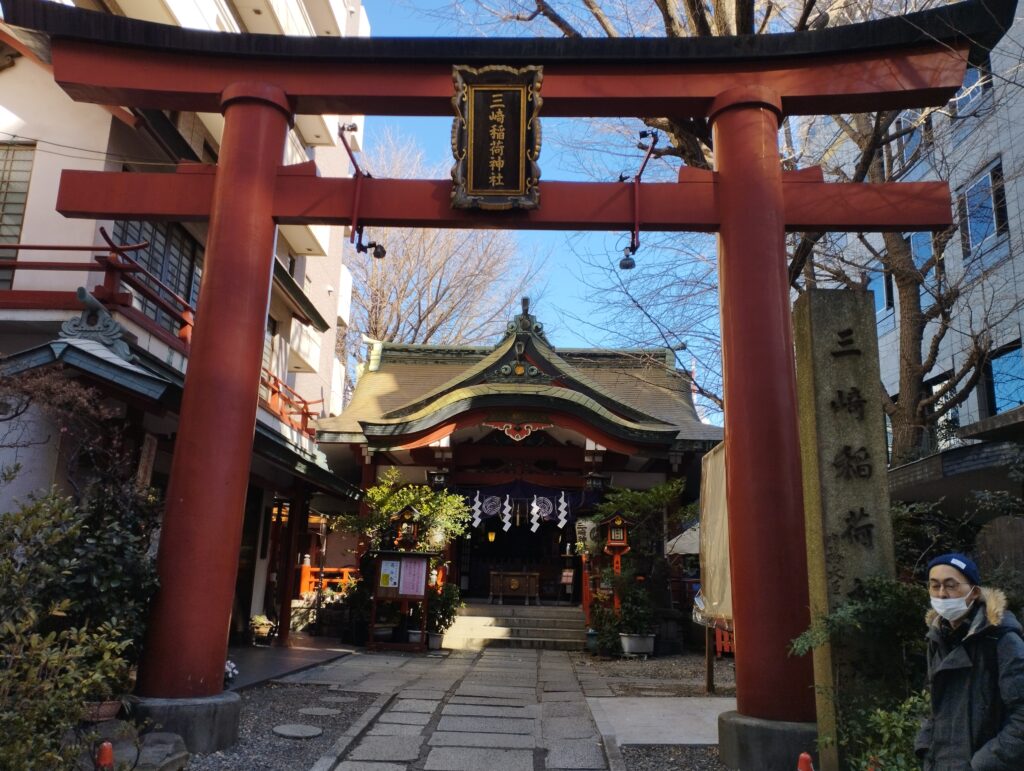
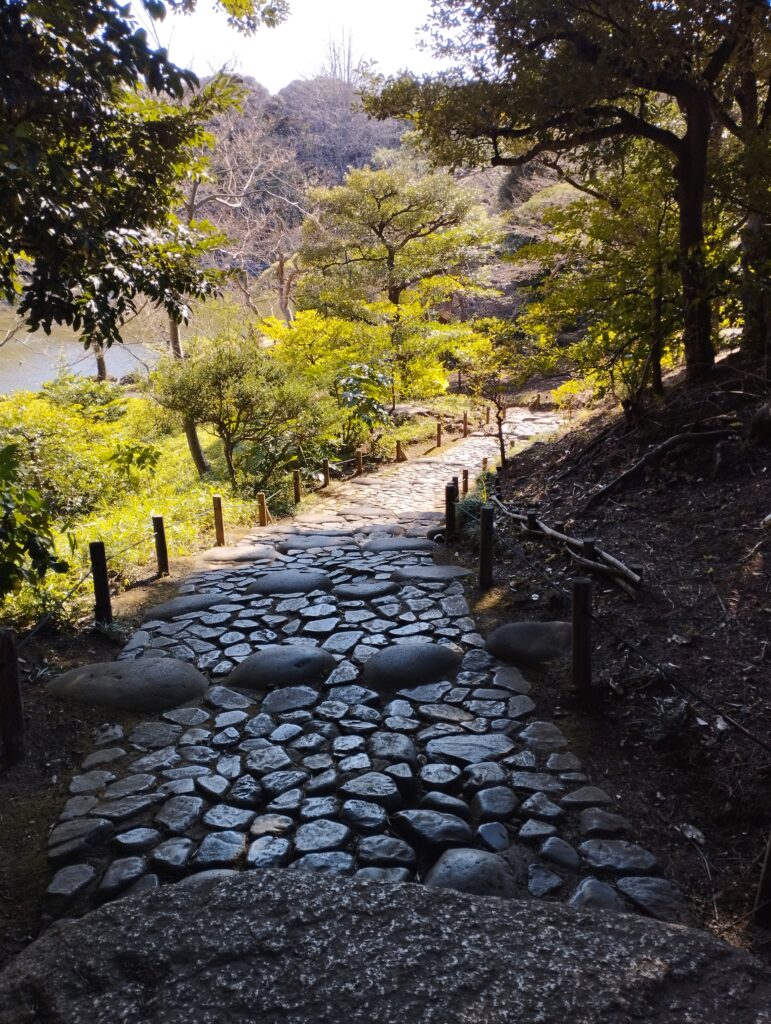
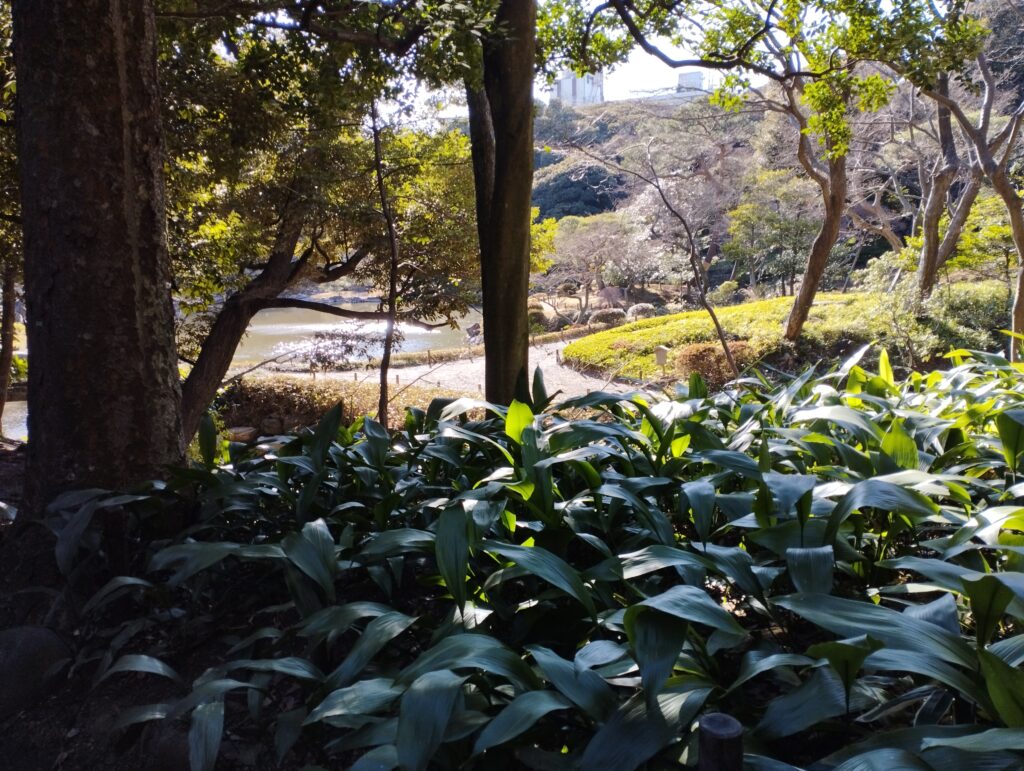
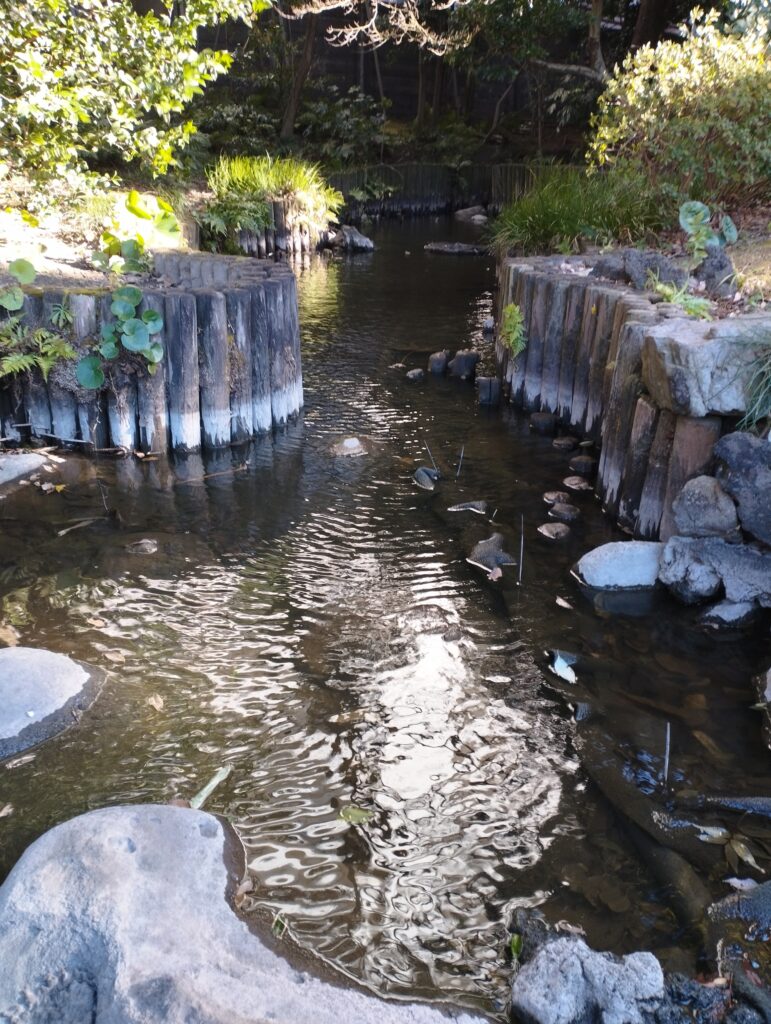
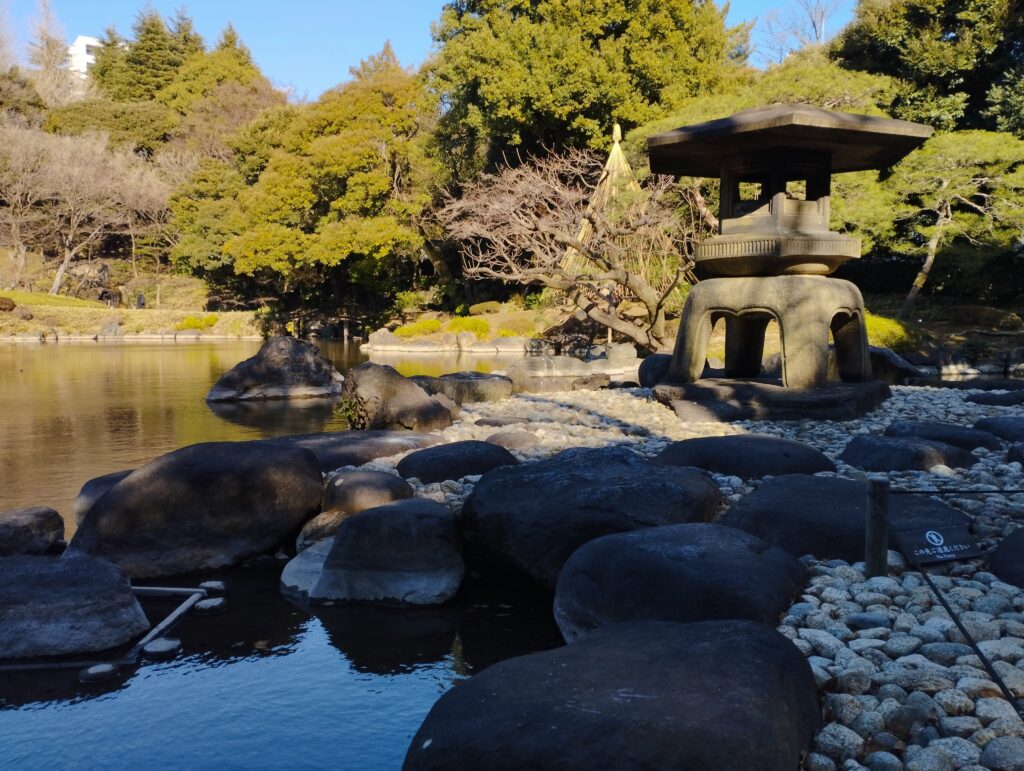
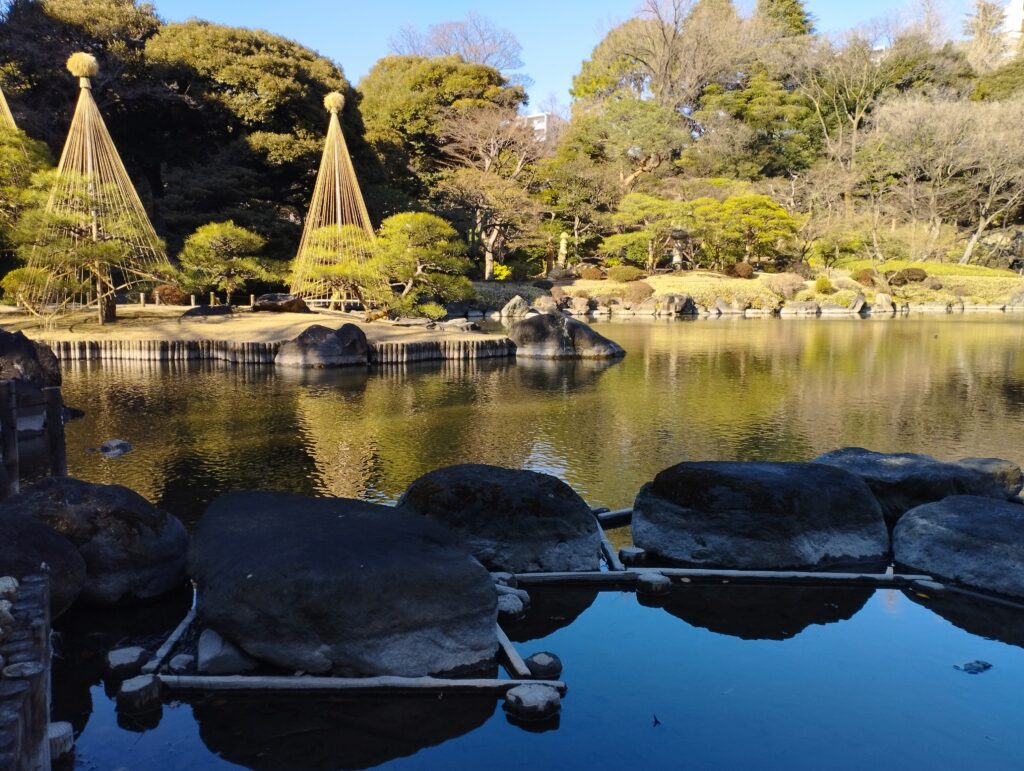
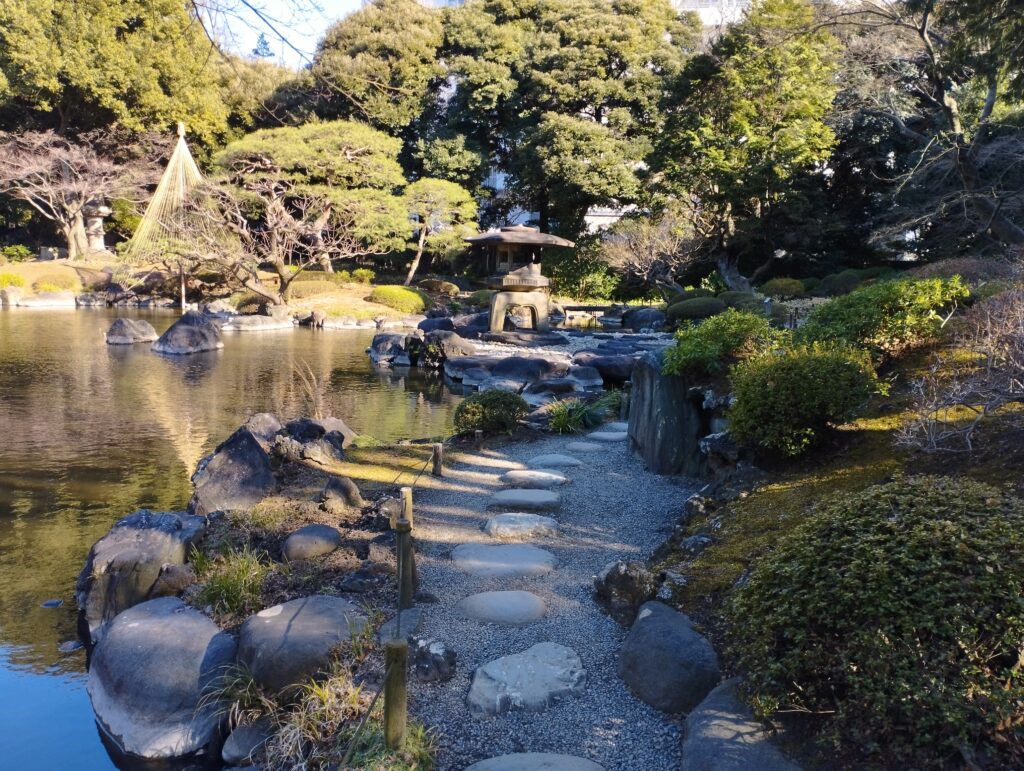
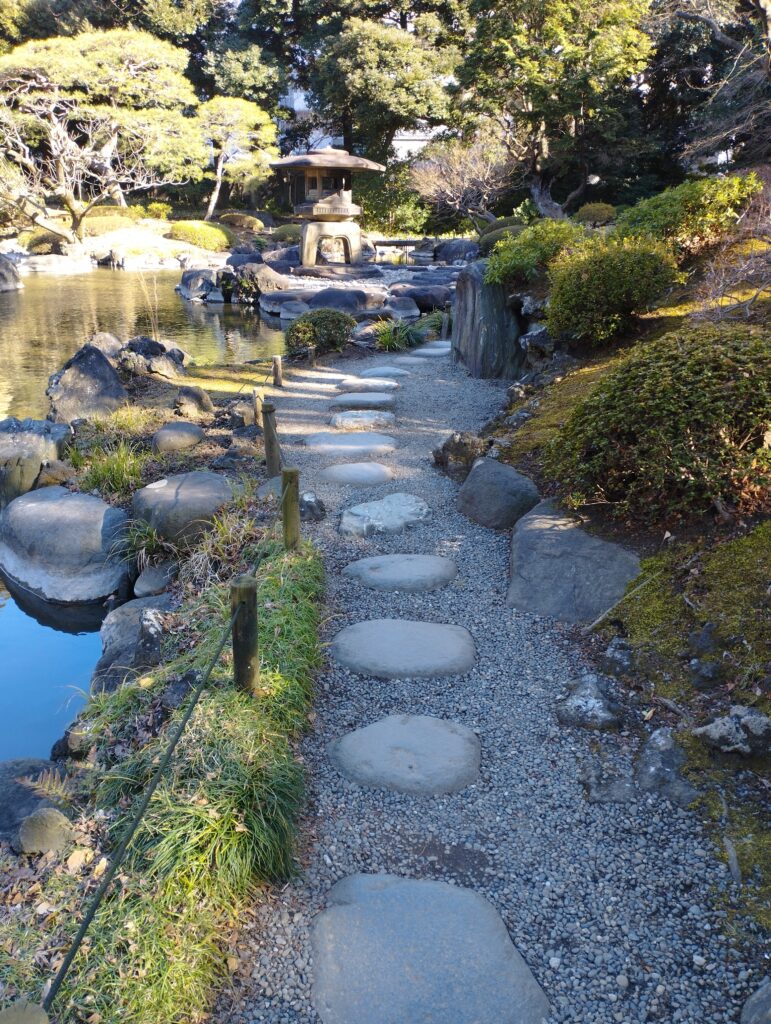
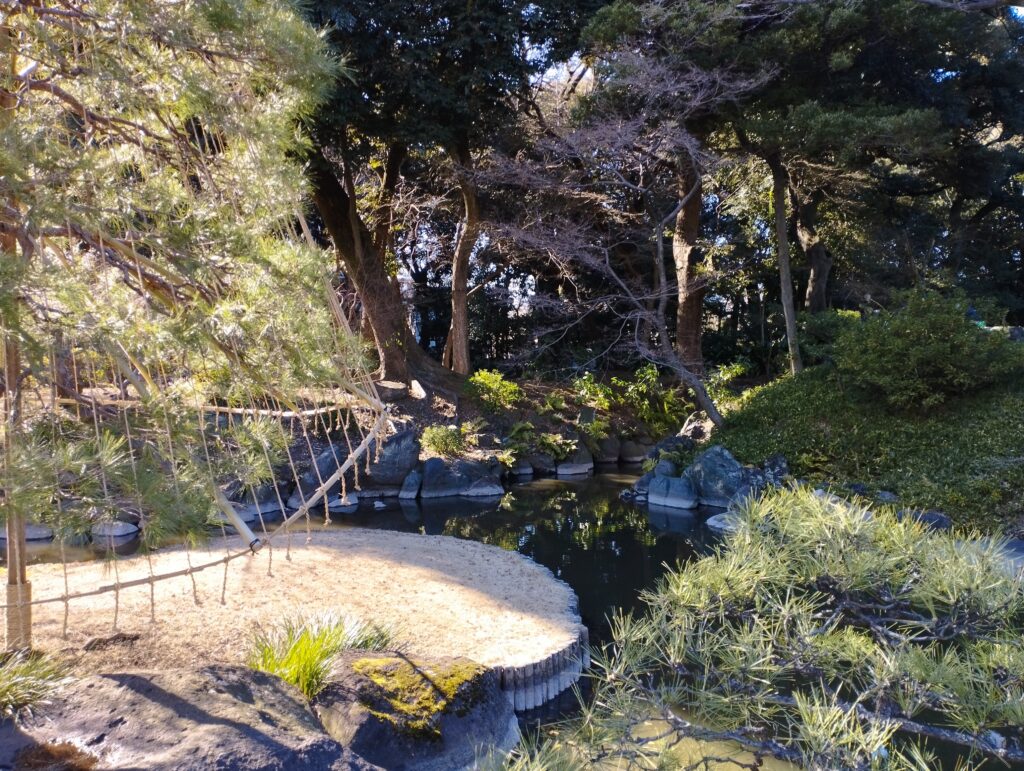
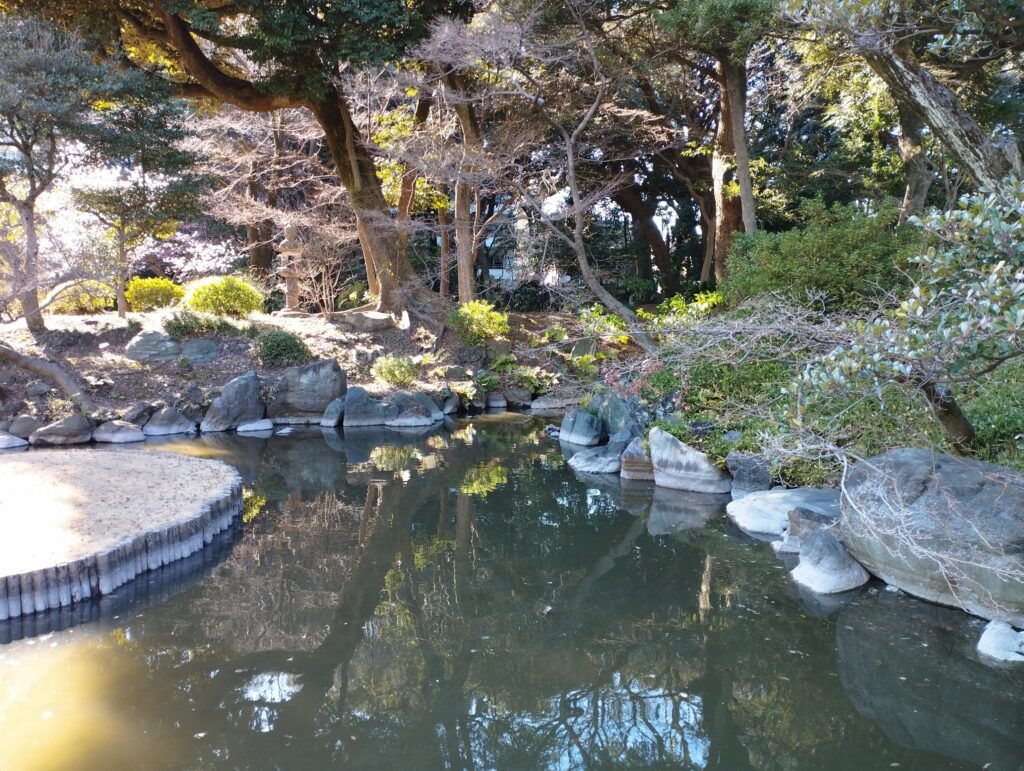
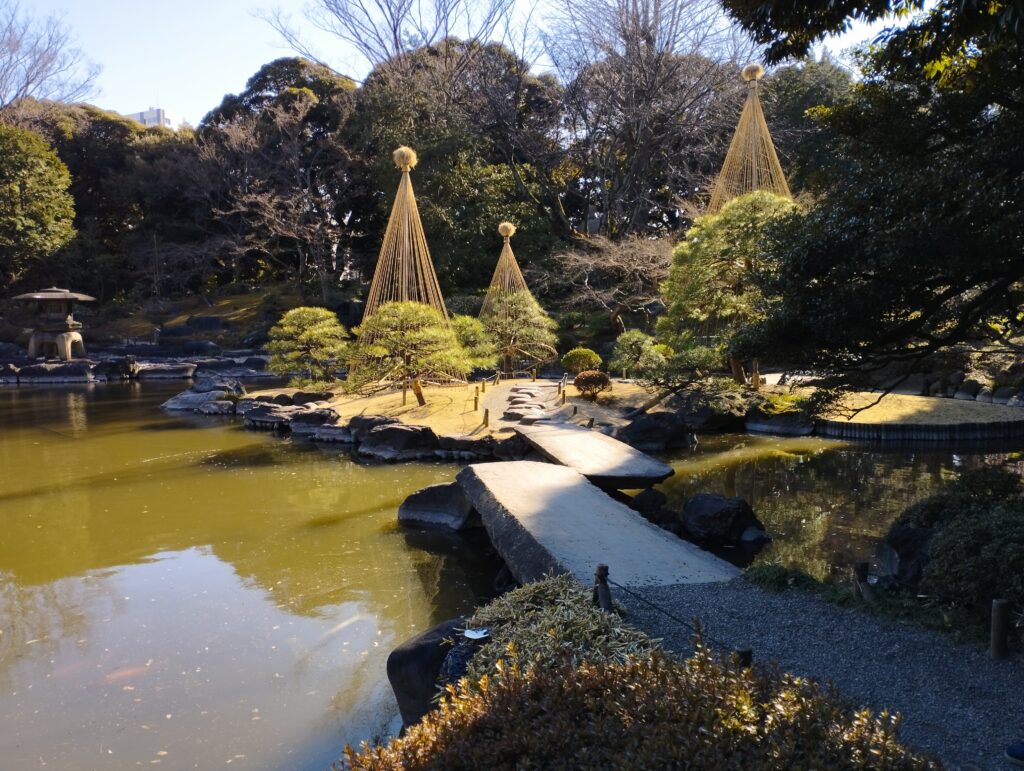
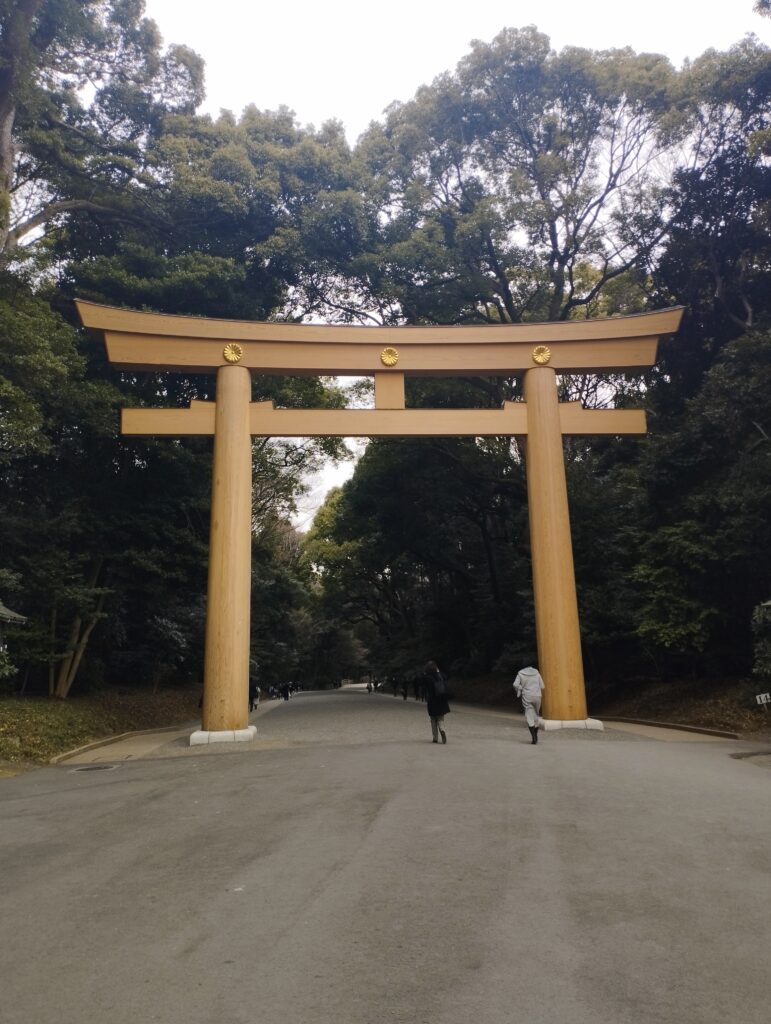
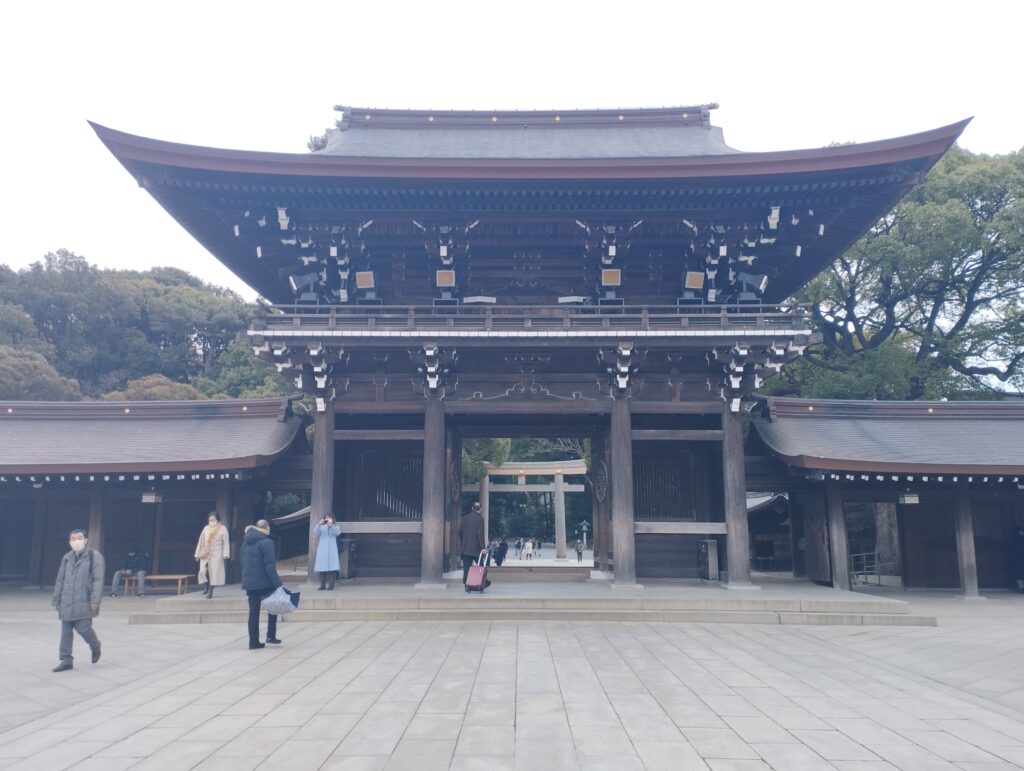
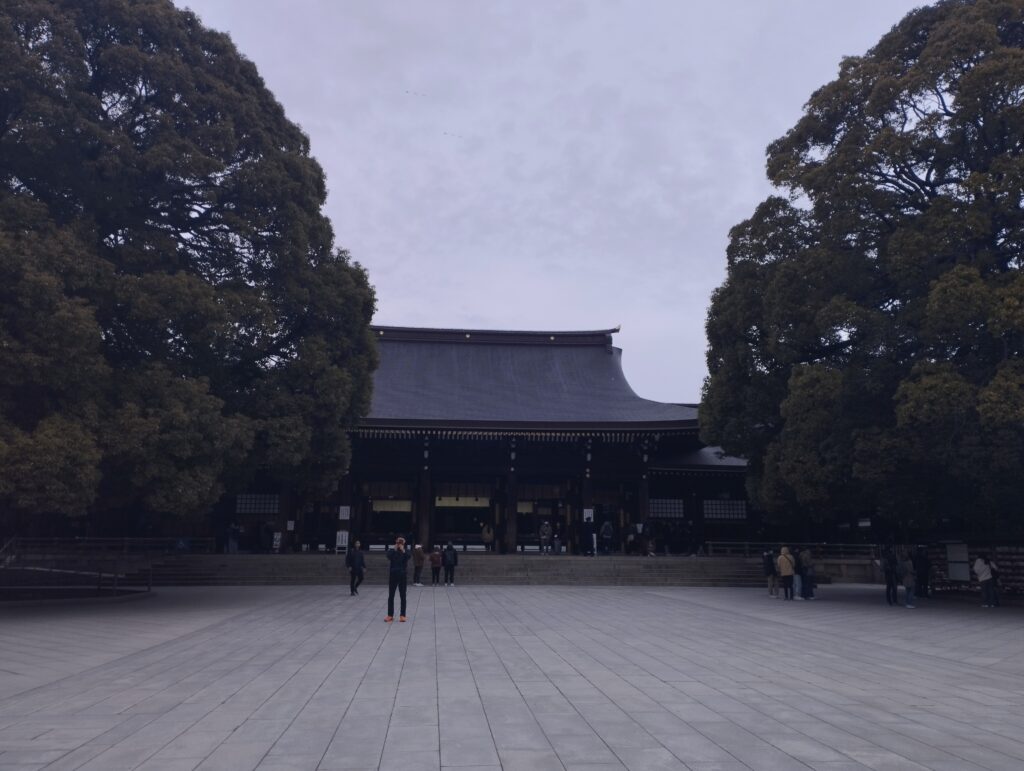
On Tuesdays we had older-culture related courses, going from shintoism to Japanese gardens and tea ceremony. We learnt a lot on people’s thoughts on shintoism thanks to volounteers, what are the main practices, where do they pray, what are the main elements in these sanctuaries, and if they see themselves as shintoists or not. About Japanese gardens, we learnt what are the different types of gardens (rock, tea, pond) and what we can find in them. We also studied tea ceremony, what people do there and how and the whole ritual around it and how meticulous people are during them. We also had the chance to participate in a few tea ceremonies after these courses.

On Wednesdays, we learnt about very broad topics among Japanese society and culture. We for example learnt about Japanese natural disasters like earthquakes, tsunami, Typhoons. We had the chance to go to a disaster prevention building(防災館)and to learn how to react in case any disaster would occur. Fun fact, I felt the first earthquake in my life on the day after this visit. During this course, we also talked about Japanese mindset and its origins, why they think more about the group than themselves. It was a very interesting course where I could learn a lot of things.

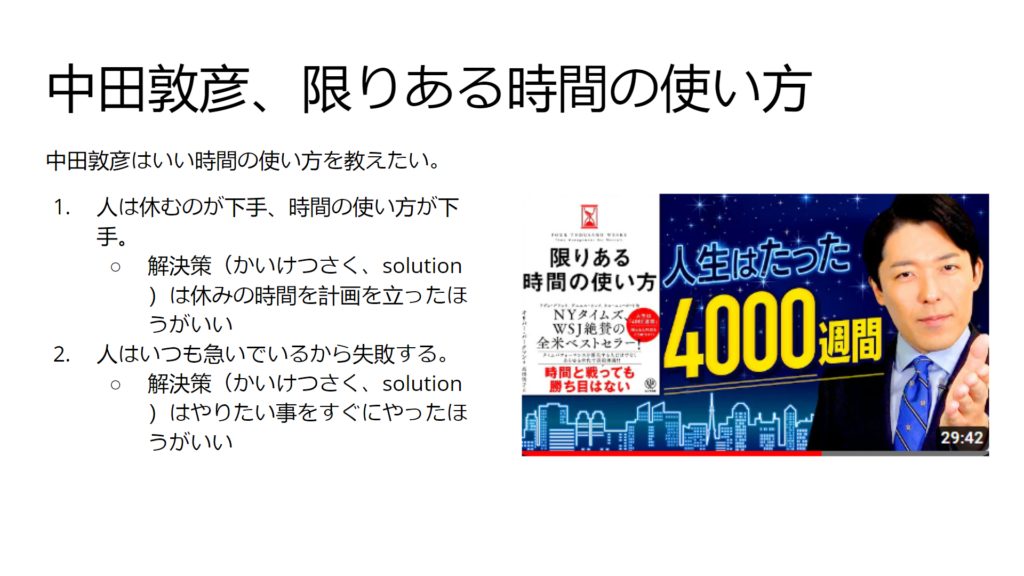
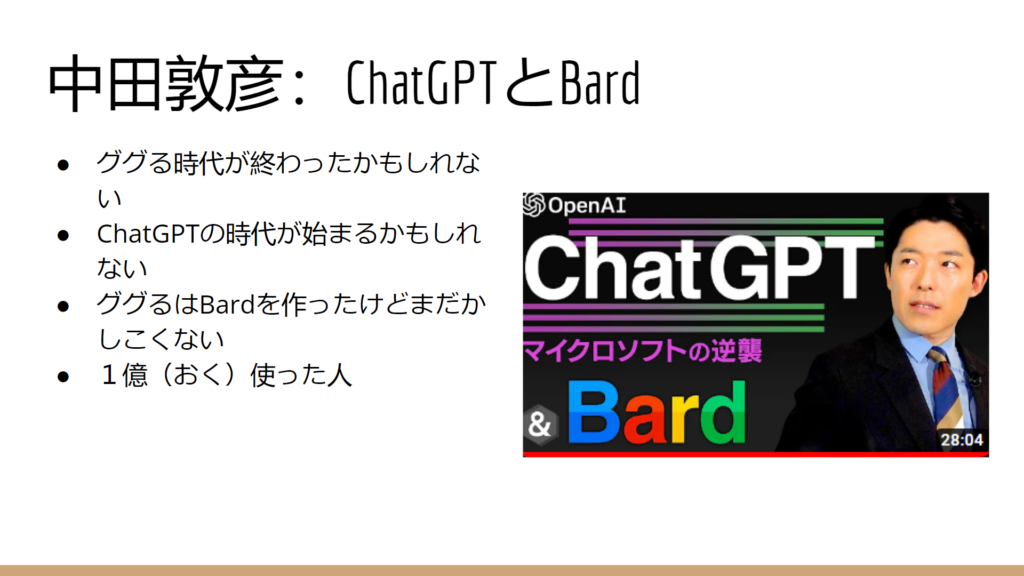
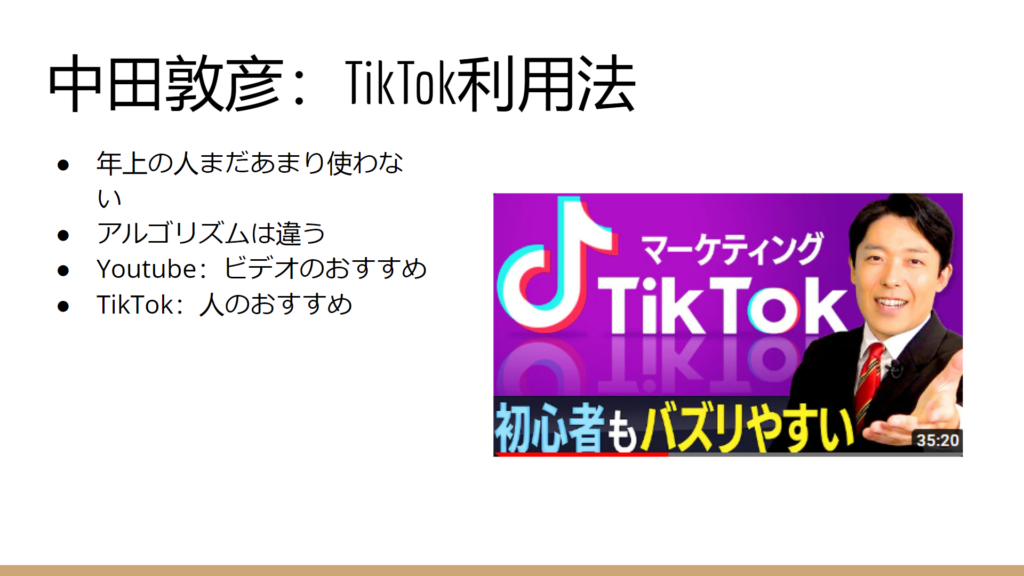
On Thursdays, we had autonomous learning courses. It’s a course where we could learn Japanese the way we wanted to with help from Japanese students. We were told that we could for example learn through musics, poems, movies, books and a lot more. I personally learnt most of the time using youtube videos from the « Nakata University » channel. Nakata is a youtuber talking about a very wide range of topics from self improvement tips to recent technologies or society. I felt that learning through his videos was very helpful as I could understand a good part of it and that I could learn and understand the other part thanks to the volounteers’ help.

School trips

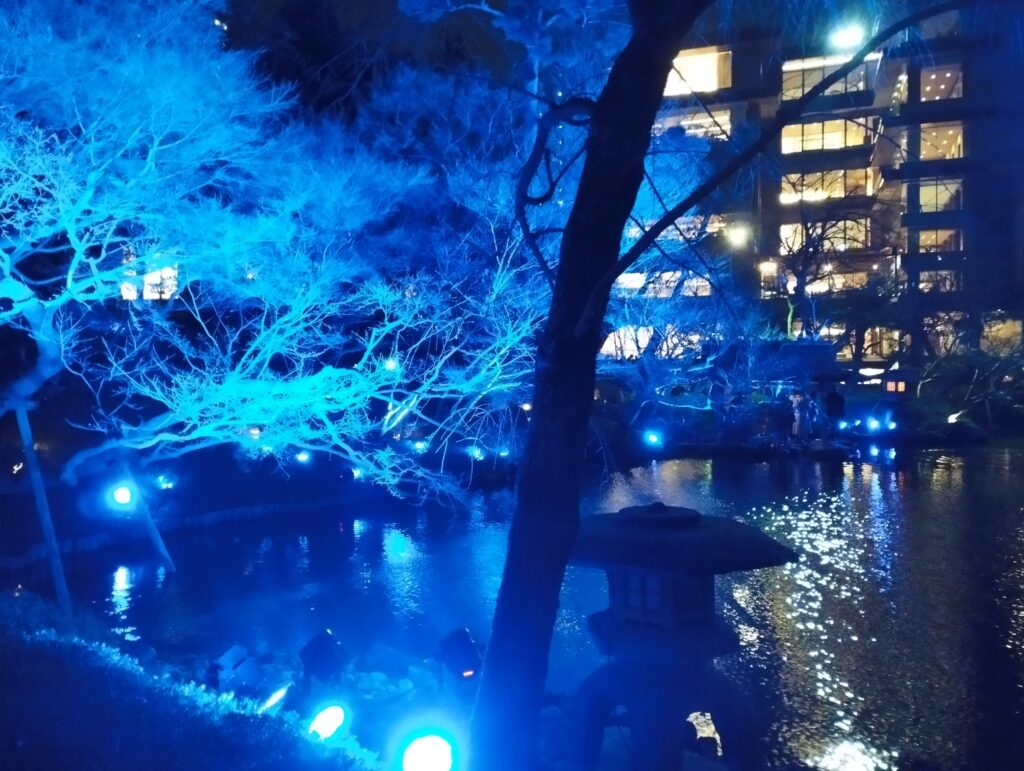
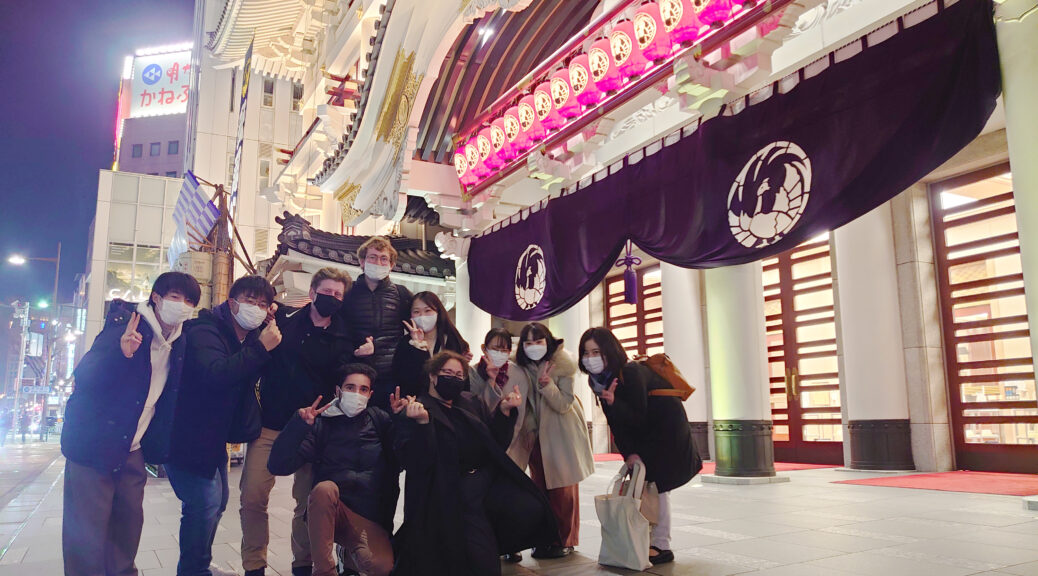
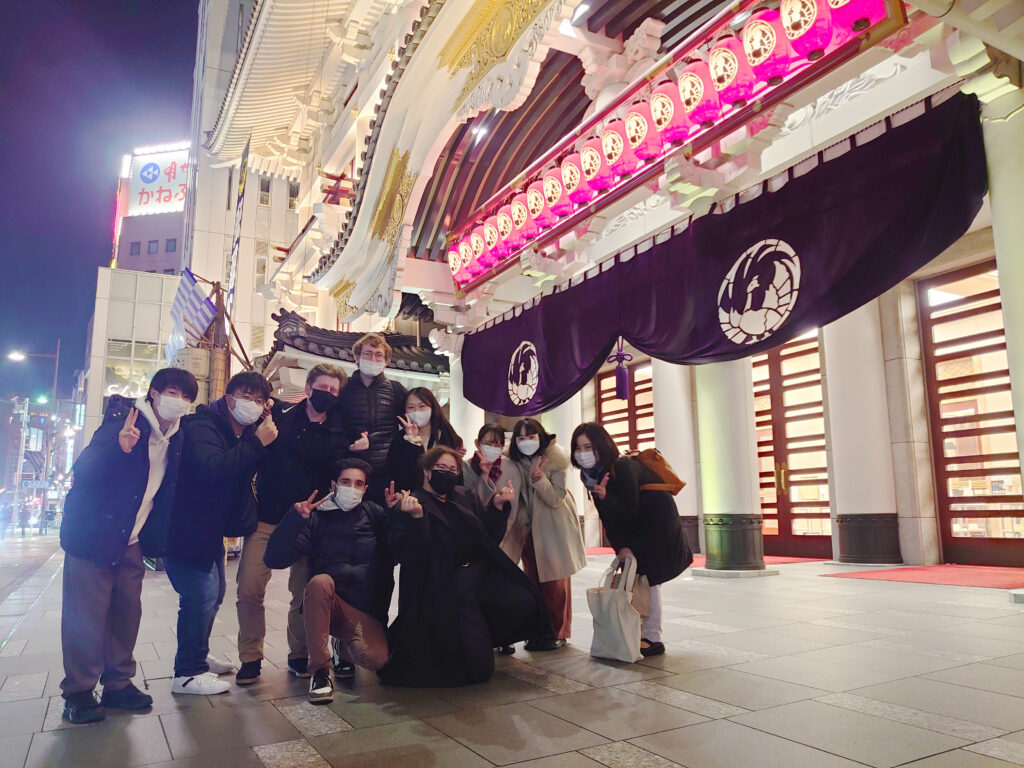
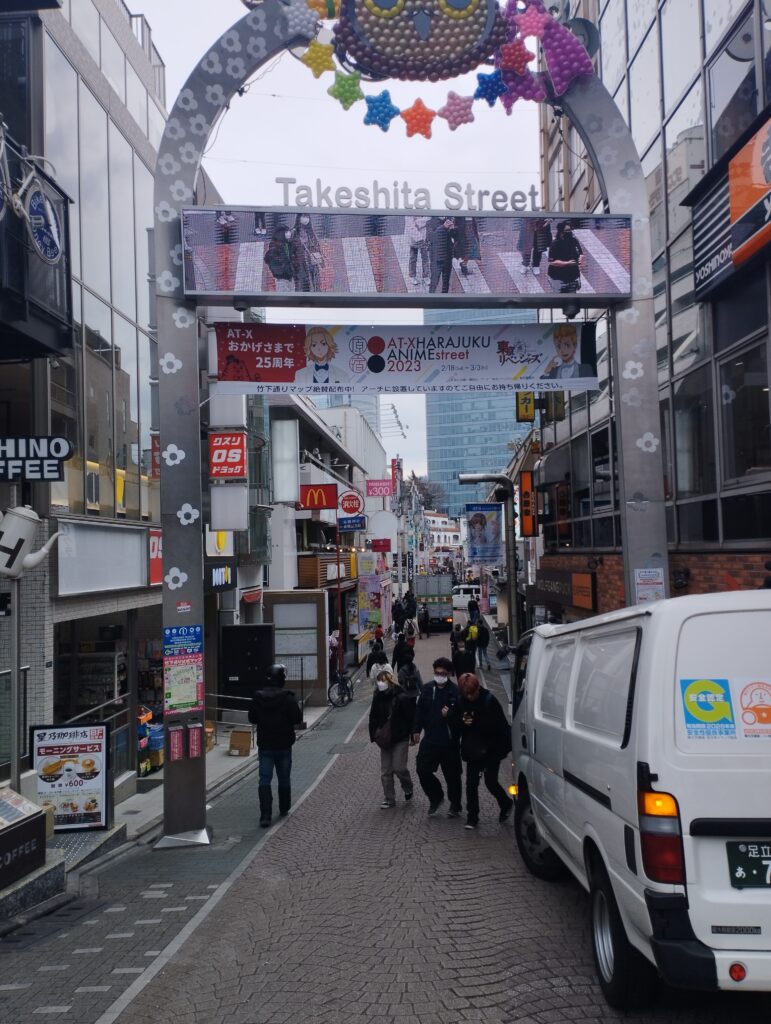
Apart from these courses, we also had a few school trips in different places, Tokyo and aside. We had for example a trip to watch a Kabuki play in the evening which was very interesting to see even if it was hard understanding what was being said because of the old Japanese used in this kind of plays. Outside the Kabuki building, we took my favorite picture of my whole 3-month time in Japan. We also had a trip we prepared ouselves in Harajuku to be able to witness the old and modern sides of this district which is something that we can find a lot in Tokyo, as well as another one in Yokohama.

My favorite picture from my time in Japan

Conclusion

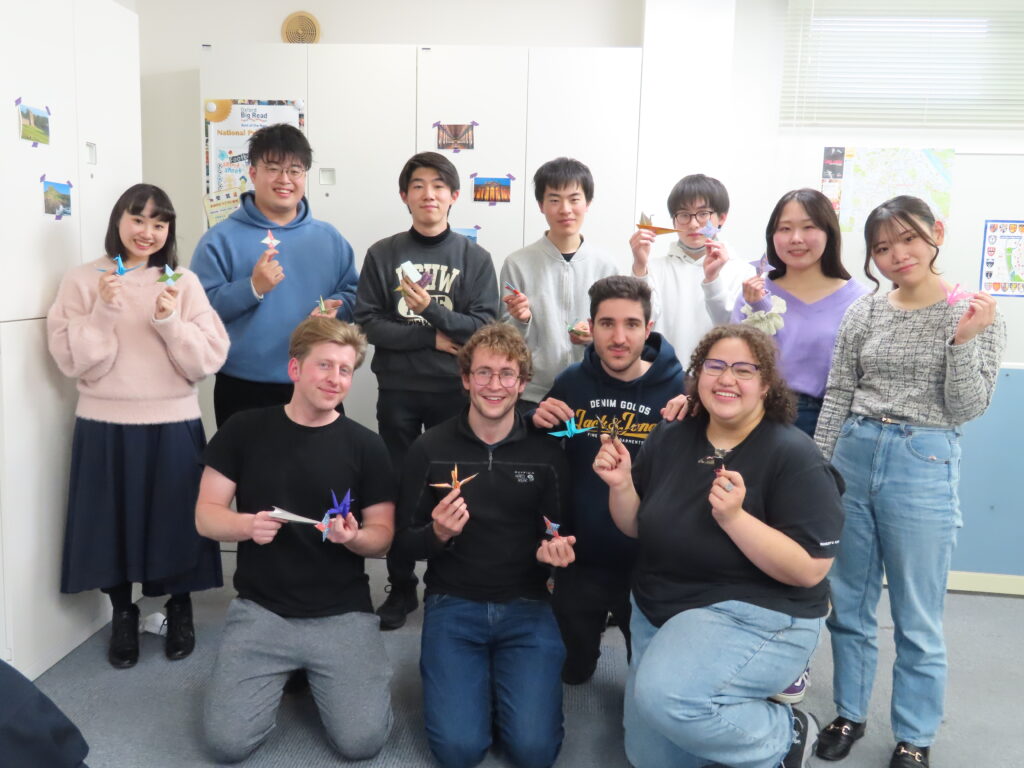
To conclude, I definitely could fulfill the main goal of this trip which was Japanese language learning as well as witnessing myself the cultural differences and to see if I liked the life there or not, and the answer is an undoubtful yes. I want to give a special thanks to everyone who was aside us from the university, from office workers who helped us a lot in everything we wanted to do, to teachers that were always very energetic, smiling and giving their all to help us as well as to volounteering Japanese students thanks to whom we could learn even more Japanese, build great friendships and spend some great time all together in Japan !

L’Iceberg du numérique

L’Iceberg du numérique

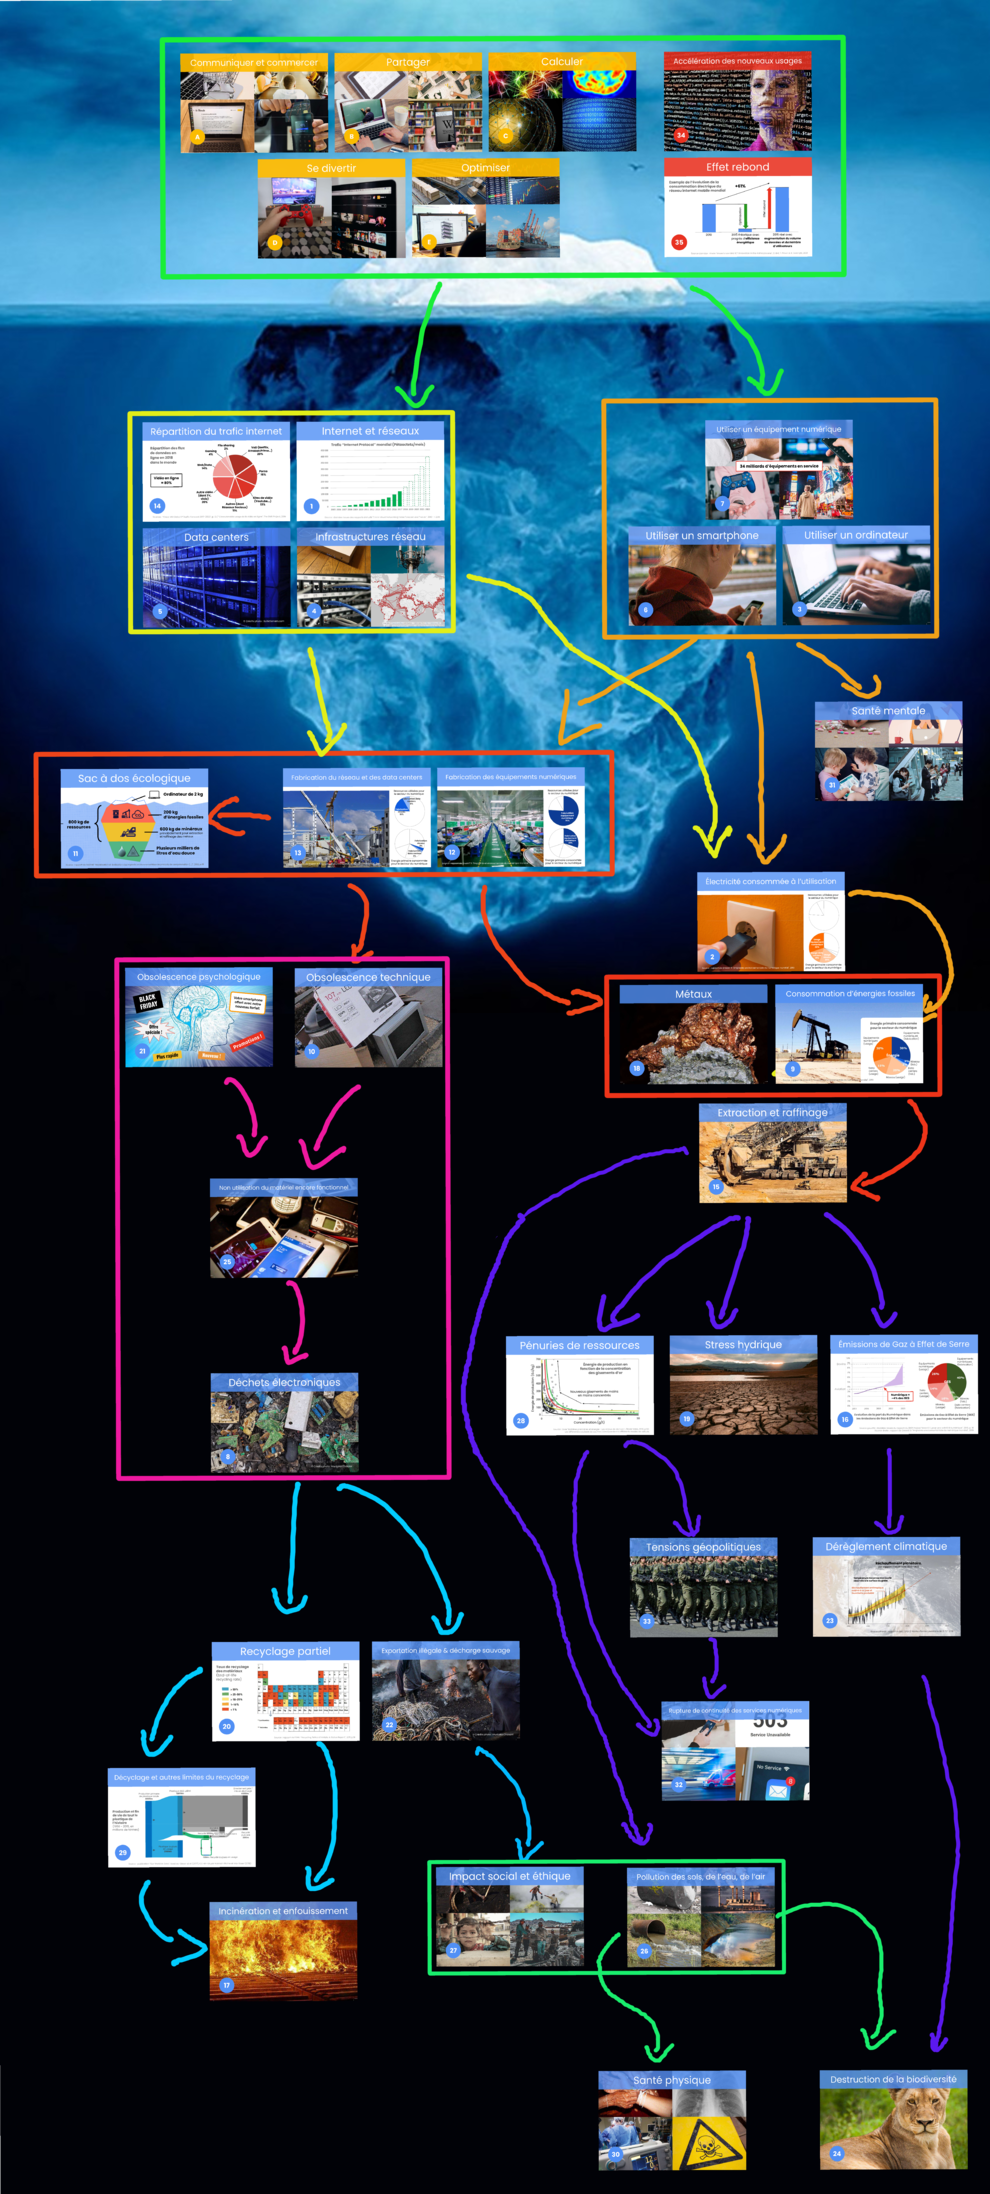
Dans le cadre du cours de CMI 10, nous avons pu participer à une activité très particulière: « La Fresque du Numérique ». Le but de cette activité est de sensibiliser les personnes qui y participent aux différents impacts que le numérique a sur notre monde.

Cet article a pour but de présenter le résultat de cette activité avec notre groupe sous une forme familière pour les internautes d’aujourd’hui: L’Iceberg du Numérique.

(Pour une meilleur expérience de lecture, veuillez zoomer la page vers les ~180%)

Iceberg du Numérique

Fresque décrivant les différents impacts du numérique
Les différentes utilisations du numérique Internet et ses différents composants Nos interactions avec le numérique Fabrication des équipements et notion de sac à dos écologique Obsolescence (technique et psychologique) Impact social du numérique Le décyclage et autres limites du recyclage Incinération et enfouissement Consommation d'énergies fossiles Les métaux utilisés dans le domaine du numérique Extraction et raffinage Électricité consommée à l'utilisation La santé mentale Rareté des ressources et tensions géopolitiques

Les différentes utilisations du numérique

Le numérique a radicalement refaçonné notre monde.

Il nous permet d'automatiser et d'optimiser des tâches fastidieuses, ainsi que de résoudre des calculs complexes pour faire avancer la recherche.

Il nous permet également de communiquer, de commercer, nous divertir, ainsi que de partager nos connaissances, par exemple via des encyclopédies en ligne.

Cela implique d'utiliser un équipement numérique, et bien souvent le réseau internet.

Cartes concernées: Accélération des nouveaux usages (34), Effet rebond (35) -> Communiquer et commercer (A), Partager (B), Calculer (C), Se divertir (D), Optimiser (E)

Internet et ses différents composants

Internet est un réseau d'équipements numériques interconnectés.

Nos données transitent via une infrastructure complexe, ainsi que par des data centers.

Le monde reposant de plus en plus sur des services en ligne, le trafic sur internet est en croissance exponentielle.

Cependant, environ 80% de ce trafic est uniquement utilisé pour diverses applications en rapport avec le partage de vidéos en ligne.

Tout cela a bien entendu un coût, notamment une forte consommation d’électricité, ainsi que de métaux lors de la fabrication d'équipements numériques et le déploiement de data centers.

De plus, les avancées technologiques provoquent l’obsolescence des équipements, qu'il faut alors remplacer.

Cartes concernées: Internet et réseaux (1), Infrastructures réseau (4), Data centers (5), Répartition du trafic Internet (14)

Nos interactions avec le numérique

Nous utilisons divers équipements numériques au quotidien, que ce soit un smartphone, un ordinateur, une console de jeu ou bien un écran connecté.

Tous ces équipements ont un coût à la fabrication, ainsi qu'à l'utilisation en consommant de l'électricité.

Ils peuvent également parfois avoir un effet néfaste sur notre bien-être mental.

Cartes concernées: Utiliser un ordinateur (3), Utiliser un smartphone (6), Utiliser un équipement numérique (7), Santé mentale (31).

Fabrication des équipements et notion de sac à dos écologique

En plus de la consommation en électricité qu'exigent les différents appareils lors de leur utilisation, leur fabrication est également très coûteuse en énergie, que ce soit pour des ordinateurs de bureau ou pour les data centers.

Leur fabrication doit également être prise en compte dans l'explication de leur consommation et de leur impact sur l'écologie.

Cartes concernées: Fabrication du réseaux et des Data Centers (13), Fabrication des équipement numériques (12) -> Sac à dos écologique (11)

Obsolescence (technique et psychologique)

Le matériel informatique ne dure pas, et ce pour plusieurs raisons, qu'elles soient psychologiques, matérielles ou logicielles.

Du matériel inutilisable ou jugé inutilisable n'aura très probablement pas de seconde vie, et ses composants seront jetés, et finiront dans des décharges où leur sort est aléatoire.

Le recyclage lui-même est une solution imparfaite au problème, de par la nature de l'électronique et les limites du recyclage.

À terme, beaucoup de ces objets finiront au mieux détruits, au pire stockés indéfiniment.

Cartes concernées: Obsolescence psychologique (21), Obsolescence technique (10), Non utilisation du matériel encore fonctionnel (25), Déchets électroniques (8)

Impact social du numérique

La recherche de toujours plus de ressources produit des industries spécialisées et des marchés fragiles aux changements politiques et environnementaux.

L'impact écologique de la surexploitation des terres et des ressources amène à des tensions politiques, pouvant finir en conflits dans divers endroits de la planète.

En conséquence, la différence du niveau de vie autour du globe augmente.

Cartes concernées: Pollution des sols, de l'eau, de l'air (26), Impact social et éthique (27)

Le décyclage et autres limites du recyclage

Même recyclé, seule une petite partie des matières premières d'un équipement électronique est réutilisable (moins de 20% dans un smartphone).

De plus, beaucoup de matériaux se décyclent, c'est à dire qu'ils perdent en qualité à chaque recyclage, ce qui les rend inutilisables après quelques cycles.

Bien que le recyclage soit bénéfique, celui-ci consomme tout de même beaucoup d'énergie et de matières premières.

Les matériaux qui ne sont pas/plus recyclable sont général enfouis, ou incinérés.

Incinération et enfouissement

On parle de "valorisation énergétique" pour l'incinération quand on produit de l'énergie avec celle-ci.
Cela émet tout de même des gaz polluant l'air et laisse environ 300kg de résidus solides et de cendres par tonne de déchets brûlés, qui finiront enfouis, polluant les sols et l'eau.

Consommation d'énergies fossiles

La combustion d'énergie fossile rejette du CO2, le principal gaz à effet de serre d'origine humaine.

Plus de la moitié de la consommation d'énergies fossiles dans le secteur du numérique vient de l'usage de nos équipements, et seulement environ 35% à la fabrication.

Les combustibles fossiles sont trouvés dans la croûte terrestre, il faut donc les extraire et les raffiner.

Les métaux utilisés dans le domaine du numérique

Les équipements numériques sont composés d'énormément de métaux, environ 50 différents dans un smartphone.

Ceux-ci peuvent être des métaux communs comme le fer, l'aluminium, précieux comme l'or, le palladium, ou rares, comme le néodyme (utilisé pour faire des aimants) et le lithium (qui compose nos batteries).

Ces métaux doivent être extraits, puis raffinés pour être ensuite utilisables lors de la fabrication de nos différents équipements numériques.

Extraction et raffinage

L'extraction et le raffinage de matières premières consomment énormément d'énergie, de produits chimiques pour le raffinage, ainsi que d'eau.

Ces procédés causent énormément de pollution dans certaines parties du monde, ainsi que des problèmes sociaux.

Électricité consommée à l'utilisation

L’électricité, bien qu'elle ne soit pas polluante en elle même, est majoritairement produite avec des énergies fossiles.

Le numérique consomme au moins 5% de l'électricité mondiale à ce jour, et ce chiffre pourrait atteindre 20% en 2030.

La santé mentale

Un mauvais usage du numérique, notamment des réseaux sociaux peut être l'une des causes de nombreux troubles mentaux, tels que de l'anxiété, les troubles de la concentration...

Rareté des ressources et tensions géopolitiques

Certains pays se spécialisent dans la production et l'importation de ressources spécifiques, ce qui peut causer des pénuries lorsque les plus grands producteurs ne peuvent faire face à la demande.

Cette raréfaction des ressources peut mener à des instabilités sociales et économiques, voire même à des tensions géopolitiques entre producteurs et importateurs.

Le marché concurrentiel joue également un rôle dans ces tensions.

Cartes concernées: Pénuries de ressources (28), tensions géopolitiques (33).

Weather and landscapes in Växjö

Weather and landscapes in Växjö

What I enjoyed the most during my semester in Växjö was nature and its beautiful landscapes. Växjö is a little city of about 71k inhabitants surrounded by several lakes and is known for being the greenest city of Europe.

Being in Sweden from the end of August until early January, I’ve been able to go through three different seasons, seeing the end of summer, fall and the early winter.

Summer

Beautiful landscape at a lake during sunset

Summer in Växjö feels pretty good with temperatures around 20 to 25°C. It’s a temperature where you can enjoy everything, from barbecues to sports or bathing in lakes. It was a good time for me to arrive in Sweden knowing what I would have to face in winter.

Picture taken on the very last day of summer.

Fall

Fall, like every other season, is a very beautiful moment in Växjö. Leafs start turning yellow, orange, red, and make it even more enjoyable to have a little run around the lakes.

Something special about Växjo and Sweden in general is that, at least from my experience, it is very often (not to say all the time) cloudy, and you also have a lot of rain that comes with it. Happily, the rain there is more often than not very thin and enjoyable.

If you’re going for a walk at night, you’ll be able to witness totally different landscapes in darkness, as much in the city as in more natural places.

Winter

Winter is the toughest season to live in Sweden but is also the one that fits this country best. Under snow, this city suddenly looks totally different. During my stay, temperatures went as low as -15°C, and it’s on this day that I could take among the best pictures. This trip in Sweden taught me that it was not unbearable for me to live in a that cold place, as long as I wear clothes warm enough. The wind being not too strong there, -15°C actually feels warmer (or let’s say, less cold) than I expected !

Once again, going for a walk by night can give you a totally different view of the city, this time under beautiful snow and lights.

Courses in Linnaeus University : Information Visualization

Courses in Linnaeus University : Information Visualization

During my exchange semester in Linnaeus University, I’ve had 5 different courses. I’ve particularly liked one of them, so I’ve decided to make a blog post about it, my most favorite course : Information Visualization.

In this course, we had the very basic goal of learning a lot about the different ways to visualize different kinds of information and being able in the end to think about our own representations.

Information visualization can take a very wide range of possibilities and there can be tons of visualizations for a single group of data. The example below shows perfectly the complexity an information display can take.

Fichier:Minard.png — Wikipédia
Charles Minard’s map of Napoleon’s disastrous Russian campaign of 1812

In the above’s map, Charles Minard represented the disastrous Russian invade campaign using six different types of data : the number of Napoleon’s troops, distance, temperature, the latitude and longitude, direction of travel, and location relative to specific dates. He indeed represented all these information in a very original way that might look at first a little bit hard to understand, but once we start to understand a little the map, we can get really quickly the picture out of it.

During this course, we have seen a lot of different visualization techniques like preattentive processing, data transformation using dynamic queries with for example range sliders, view transformations using user interaction with for example zoom and pan, just to cite a few.

At the end of the course, we had to make our own visualization of a specific set of data about cars and their characteristics. Mine was the following :

My visualization for the final project

As we had a lot of different characteristics for each car (26 features in total), I decided to display them using three different types of chart. At first a point chart, then a bar plot and finally a star plot.

The point chart is used to display and compare every cars using the numeric data. It is possible to change the features we are comparing them with using the simple select tools.

The bar plot is used to compare the types of cars and putting them in groups using text data in a way we can easily find what type of car is a specific point on the first chart with the use of colors.

The star plot is used to display every information of a specific car after clicking on it on the point chart. So for example if we feel interested in a car because it looks cheap with a high horsepower, we can also see easily its other statistics in the star plot so we can make up our mind about it. We also can use it to compare a car to others by adding more cars on the plot.

Another important feature of my visualization was preattentive processing. Preattentive processing is what allows us to distinguish data quickly (between 50 and 500ms) thanks to a difference of representation. One of the fastest preattentive processing is when you for example decide to put a blue point on a point chart full of red points. This way, your brain will identify in a very short time the blue point, so it basically makes it easier to find specific information.

To add this on my visualization, it is as simple as clicking on a car type in the bar plot. It will then turn all the car’s point colors in red except for the type clicked on which will be then blue. This way, the user can easily identify where are all the cars with a specific feature (here, car maker : Alfa Romeo). It can be very useful when there are too many car types like in the following example with the car makers.

Visualization without preattentive processing
Visualization with Preattentive processing

I personally liked a lot this course. It was very interesting to learn about all these techniques and it was the one with the most real-life use-cases as it is a course mainly focused on design which is basically everywhere in our lives, with a focus here on information visualization.

Sweden’s Universities and Nations

Sweden’s Universities and Nations

When I arrived in Sweden in the end of August, one of the thing that first surprised me is something called « Nations ».

Sweden’s nations are basically groups of people, that everyone can join but nobody is obliged to, with whom you will be able to do a lot of activities prepared by these, like parties and games. Nations seem to be one of the best way to make friends there, to have a lot of fun and it seems to give people a sense of identity as it looks like to me to be big families.

Before the university’s new year starts, they like a lot to party for one or two weeks to enjoy their summer holidays at the fullest.
One way of doing it is to set tents in a green space and to settle there for the time you plan to party which allows you to have your own area to play. The tents also protect you from rain which comes very often in Sweden.

Nations all have their own dress code, it is mainly about having a specific top and a pant of a certain style and a chosen color by the nation where you can hang badges, so basically everyone wears the same clothes. The more you have badges, the more it means you participated in a lot of activities and you are in this Nation for a long time. A friend of me had a pant litteraly full of badges after 4 years.

These nations can have a very big amount of people in it. The nation from the picture was the biggest of all I’ve seen, and I expect their real number to be even bigger as they might not all be there.
In this picture, they were doing some kind of a competitive activity in groups.

Being a part of a nation also allows them to go to specific events or places, there is for example in Växjö a private club that is only for people among nations.

I personally enjoyed seing them having fun and I like a lot the concept of having a big group to which you belong to and in which you spend a lot of time. Even if I couldn’t join a nation, I fortunately could join the Erasmus group which was kind of similar to a nation. It did not have a specific dress code but still we had a lot of activities which includes night parties a bit like the pictures above and also different sports in the university’s gymnasium.

I wish we had something similar in French universities, I’m sure a lot of people would like to participate in something like this, spending time in a big group you can call family.

Life as an exchange student in Montréal

Life as an exchange student in Montréal

The first two weeks

I recently arrived at Montréal, one of the biggest cities in Canada and more precisely in Québec. Life here is not so different from life in France but still some things differ from what we have in France. The first thing you’re gonna notice is that almost everyone is bilingual. Since Montréal is close to the US border and English being Canada’s official language (Québec is the only province that speaks French) this is not that surprinsing.

Another thing, quite a big one as a French foreigner, is the milk. All forms of milk need to be pasteurized so way less variety of cheese can be produced from it.

Otherwise the city is beautiful, having both huge buildings and colorful parks such as the Mont Royal’s park :

Another thing is that prices can be confusing since taxes (the equivalent of TVA in France) are calculated only at checkout, meaning the price you see on the product is slightly inferior as the price you will pay. Thankfully, since Canadian dollar being less valuable than Euro, we basically have a 25% discount on everything.

Riddles

Riddles

Riddles-Nathanael-and-Audran

After J.R.R. Tolkien (« The Hobbit », chapter 5 Riddles in the Dark)
Riddles by Audran, Damien Da, Damien De, Guillaume, Julien, Ludovic, Nathanaël, Pierre, Raphaël, Sébastien
Page design by Audran & Nathanaël

Spring 2021

The five ages of modern man

The five ages of modern man

Collaborative writing, after William Shakespeare’s famous monologue in « As You Like It », Act II Scene VII

At the beginning, the newborn,
Straight from the artificial incubator center, 
One of the hundreds during the past hour,
Ready to live the same life as the others,
The result of too much porn. 

Then as he finishes his class on his tablet,
His mom wants him to explain Hamlet.
But he prefers playing super hero on Fortnite,
And he dreams of becoming a knight.

And then comes the teenager.
In his bag, some paper,
Not only to write but to roll joints,
Phone in hand, liking many pics.

And now, the stressed-out adult,
The one who has no time to himself,
Locked in his routine between kids, work, and mistress,
An exhausted one, with no juice left.

And so comes the end of the journey,
With a heart filled with regret
And forgotten memories of a bygone era.
Nothing left to do, nothing left to see,
Except reminisce about what could’ve been.

by Audran, Damien Da, Damien De, Guillaume, Julien, Ludovic, Nathanaël, Pierre, Raphaël, Sébastien
Spring 2021