Archives de
Category: Échanges internationaux

Weather and landscapes in Växjö

Weather and landscapes in Växjö

What I enjoyed the most during my semester in Växjö was nature and its beautiful landscapes. Växjö is a little city of about 71k inhabitants surrounded by several lakes and is known for being the greenest city of Europe.

Being in Sweden from the end of August until early January, I’ve been able to go through three different seasons, seeing the end of summer, fall and the early winter.

Summer

Beautiful landscape at a lake during sunset

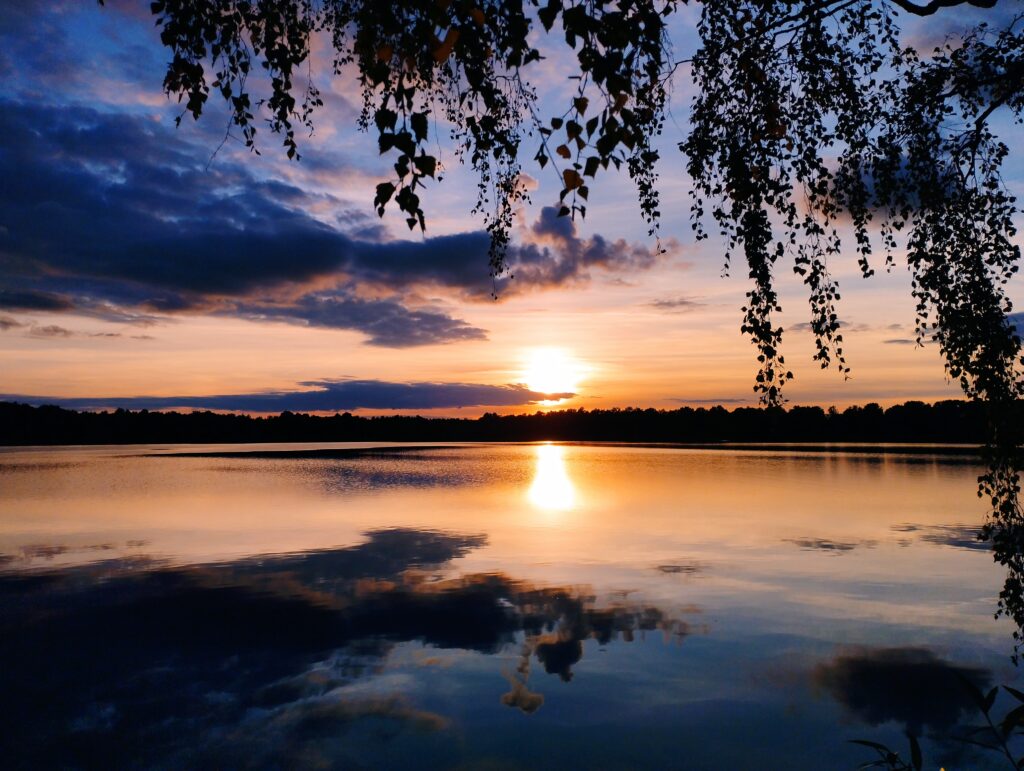
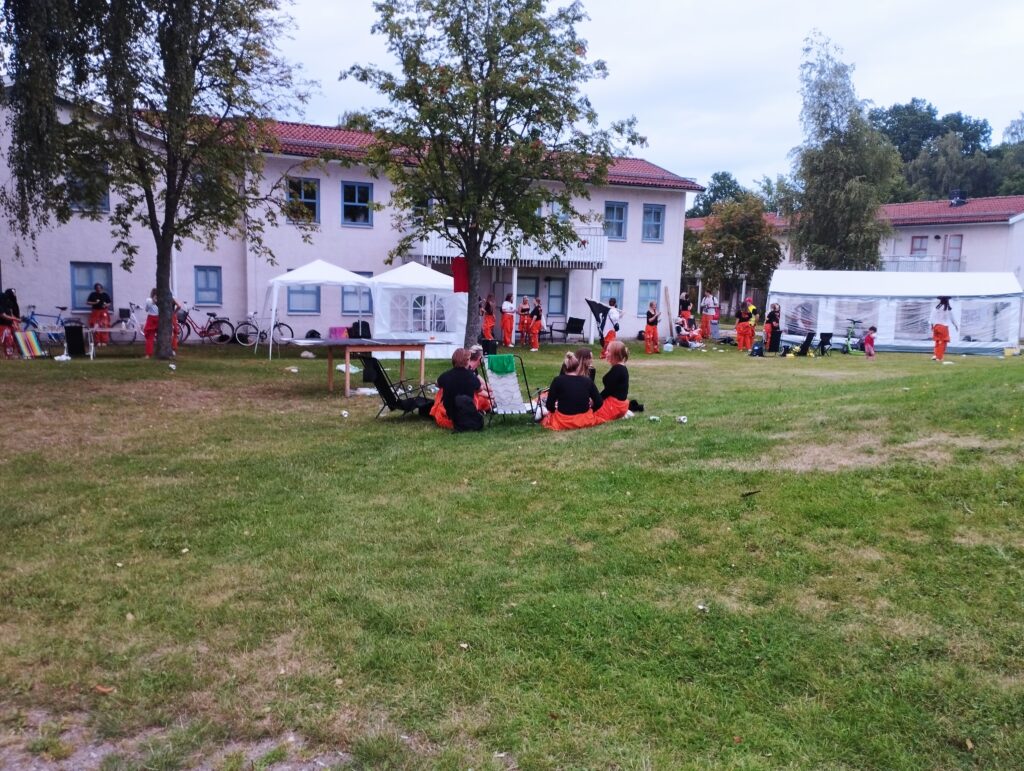
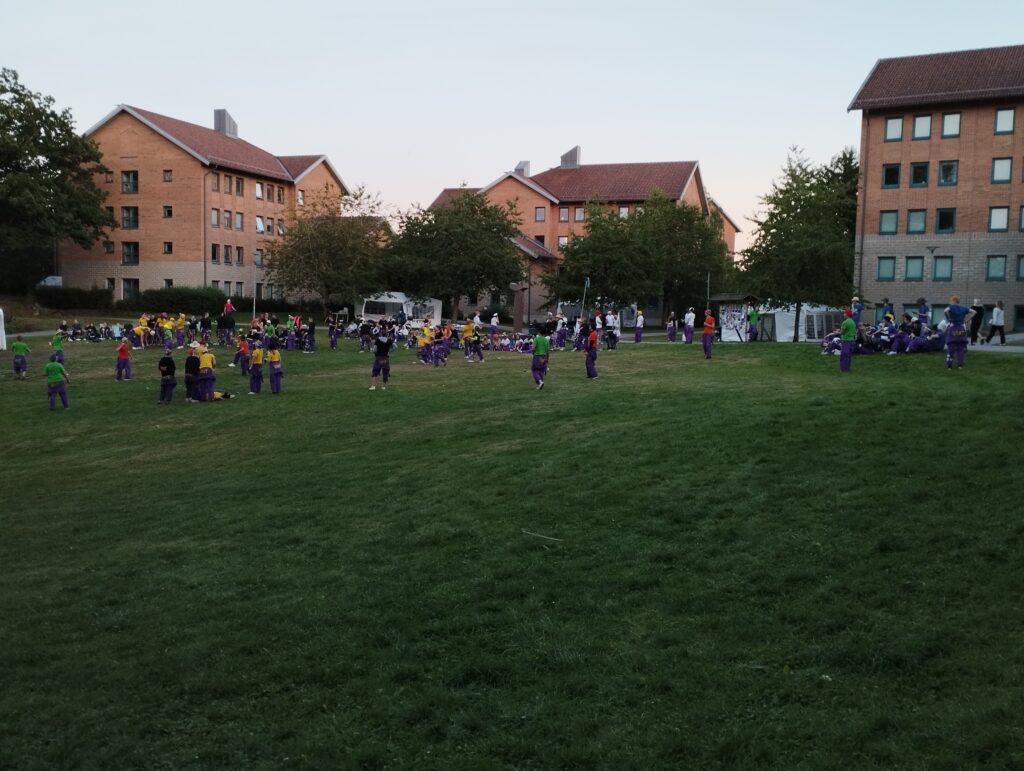
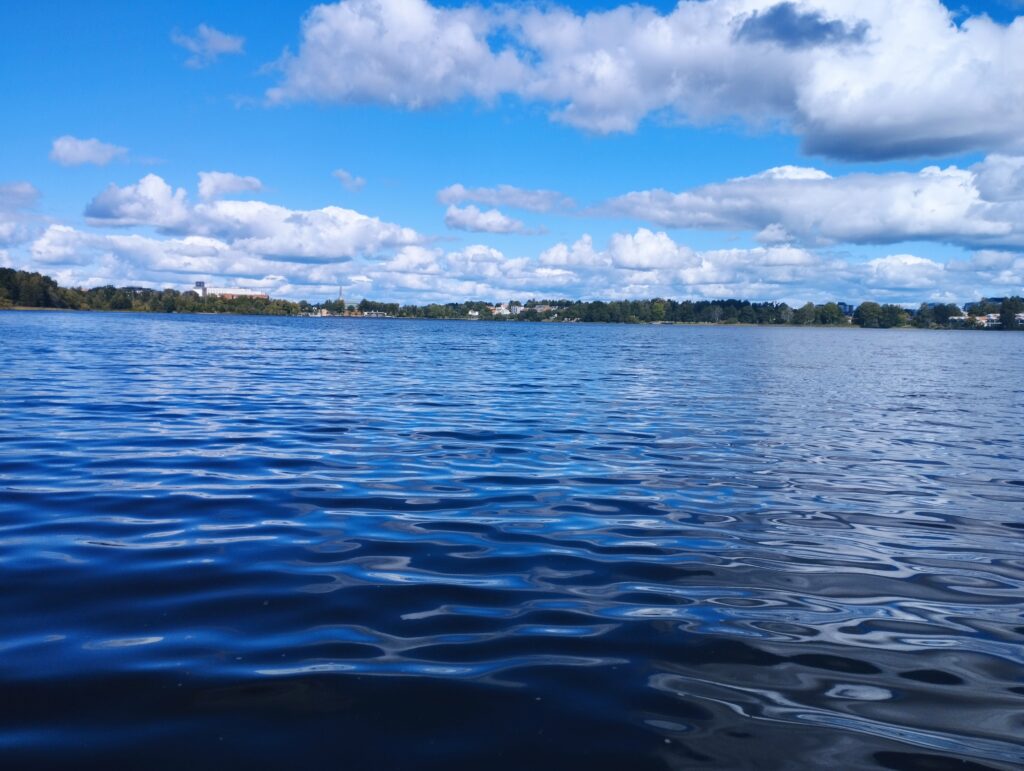
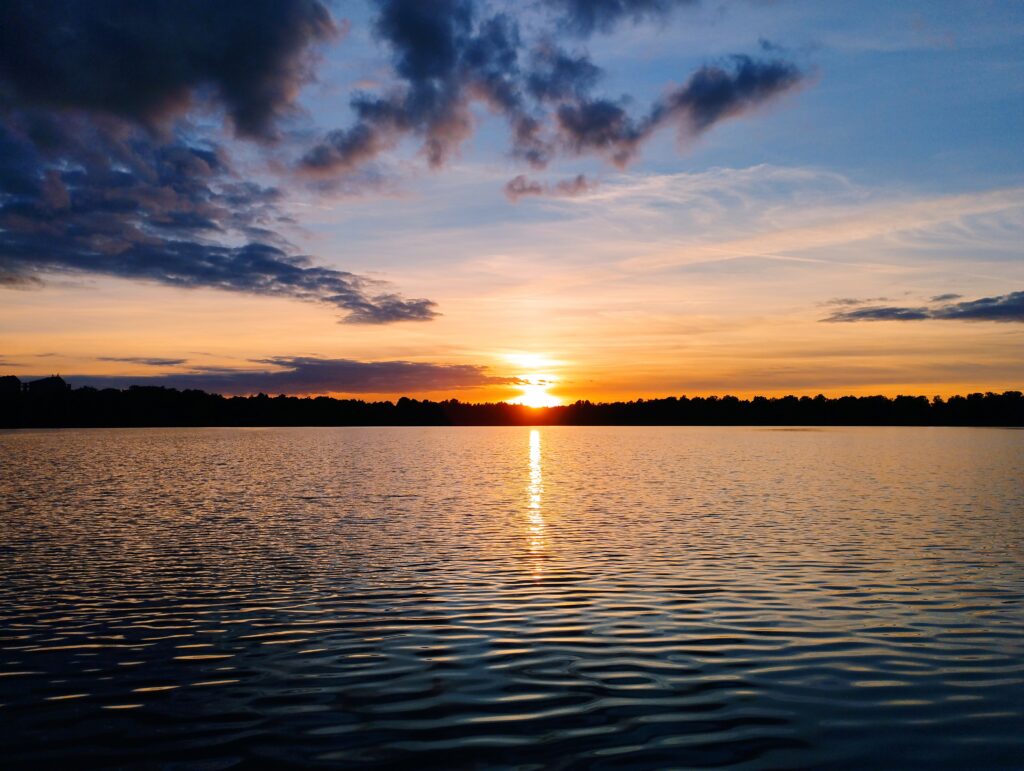
Summer in Växjö feels pretty good with temperatures around 20 to 25°C. It’s a temperature where you can enjoy everything, from barbecues to sports or bathing in lakes. It was a good time for me to arrive in Sweden knowing what I would have to face in winter.

Picture taken on the very last day of summer.
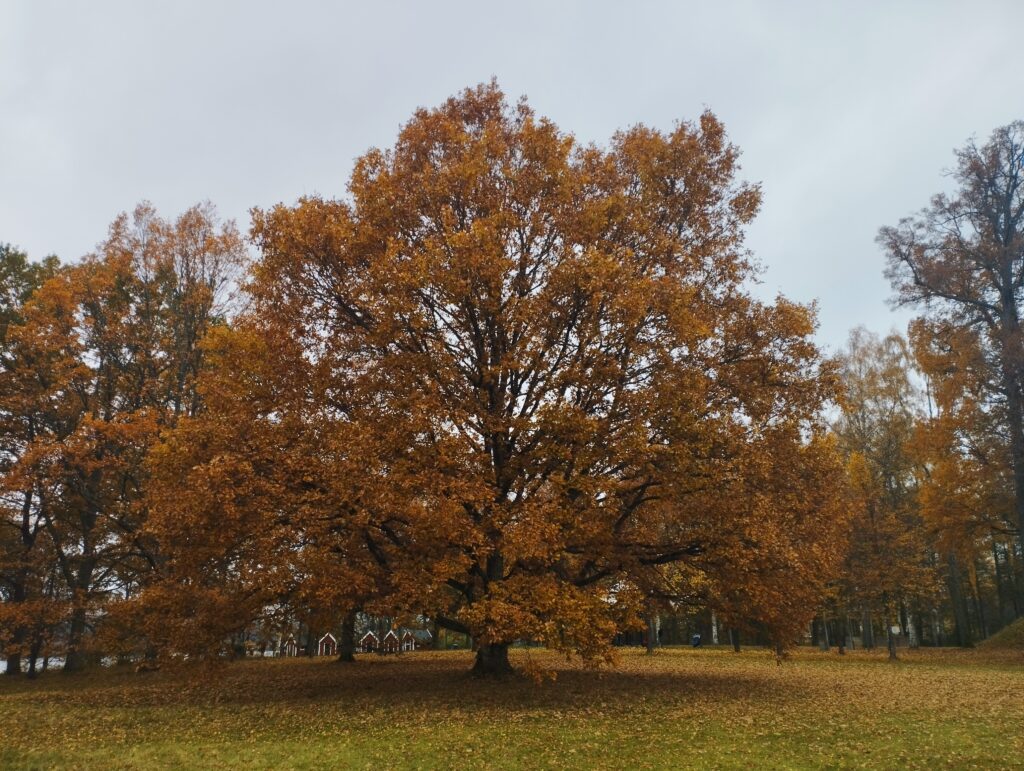
Fall

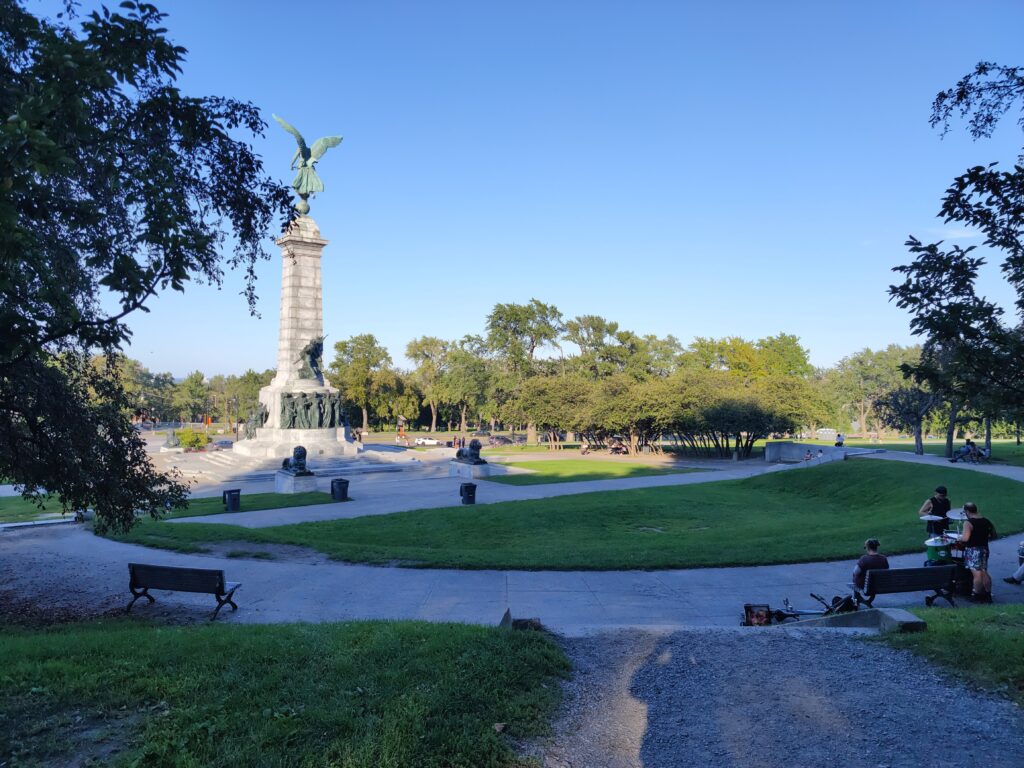
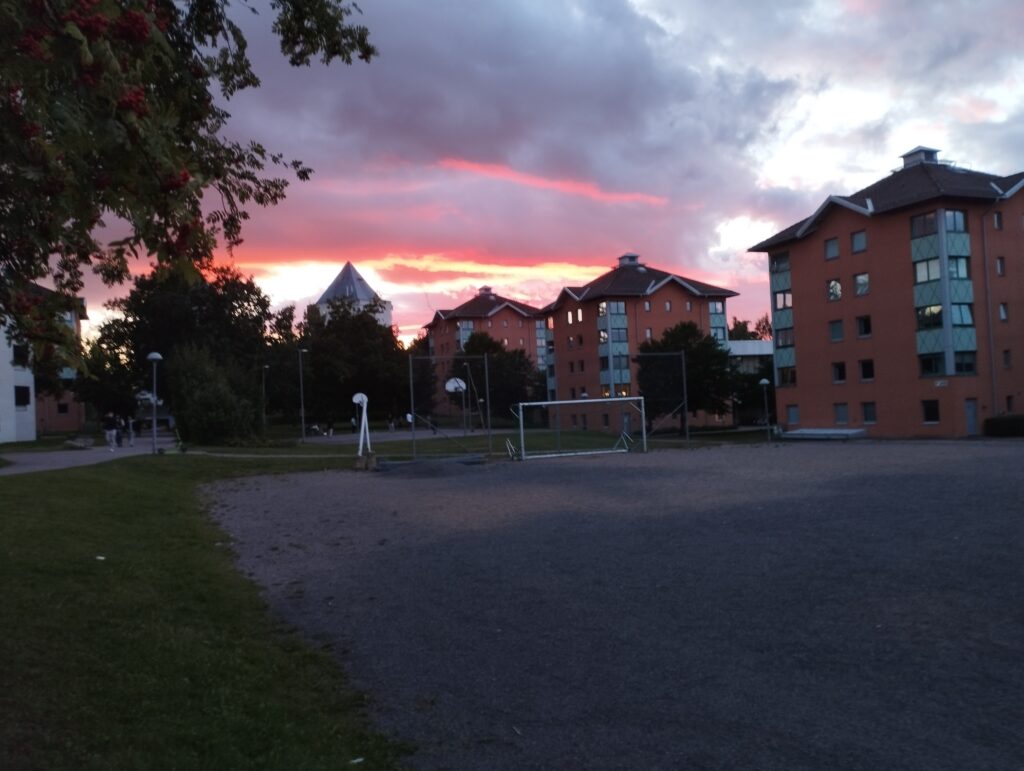
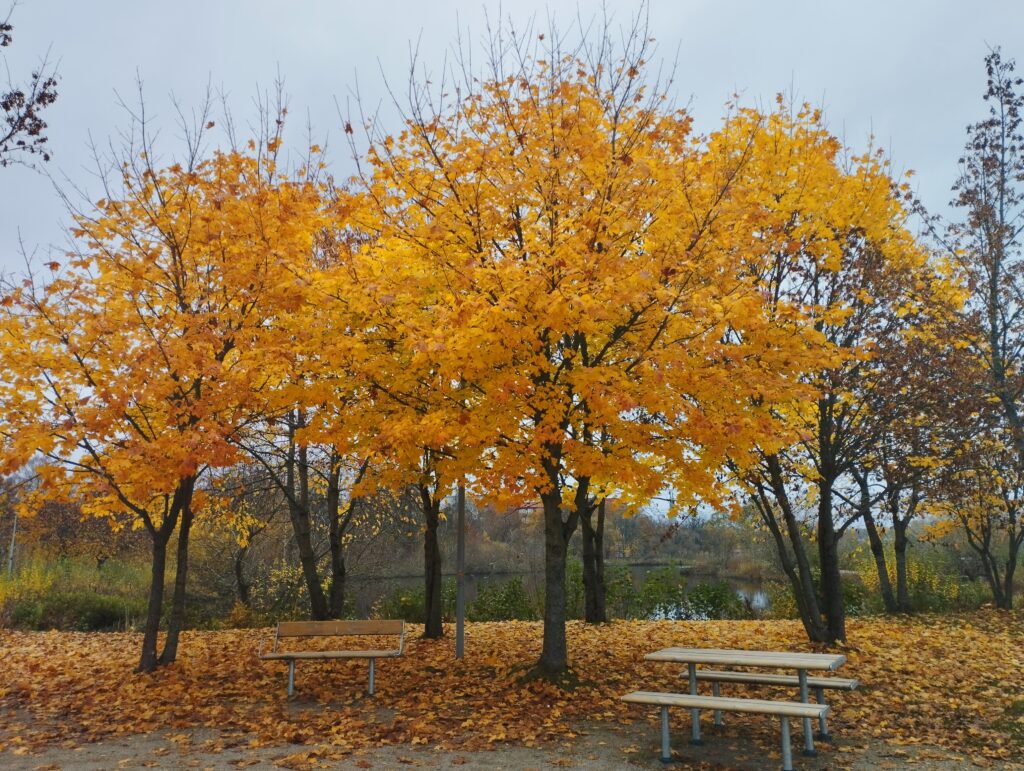
Fall, like every other season, is a very beautiful moment in Växjö. Leafs start turning yellow, orange, red, and make it even more enjoyable to have a little run around the lakes.

Something special about Växjo and Sweden in general is that, at least from my experience, it is very often (not to say all the time) cloudy, and you also have a lot of rain that comes with it. Happily, the rain there is more often than not very thin and enjoyable.

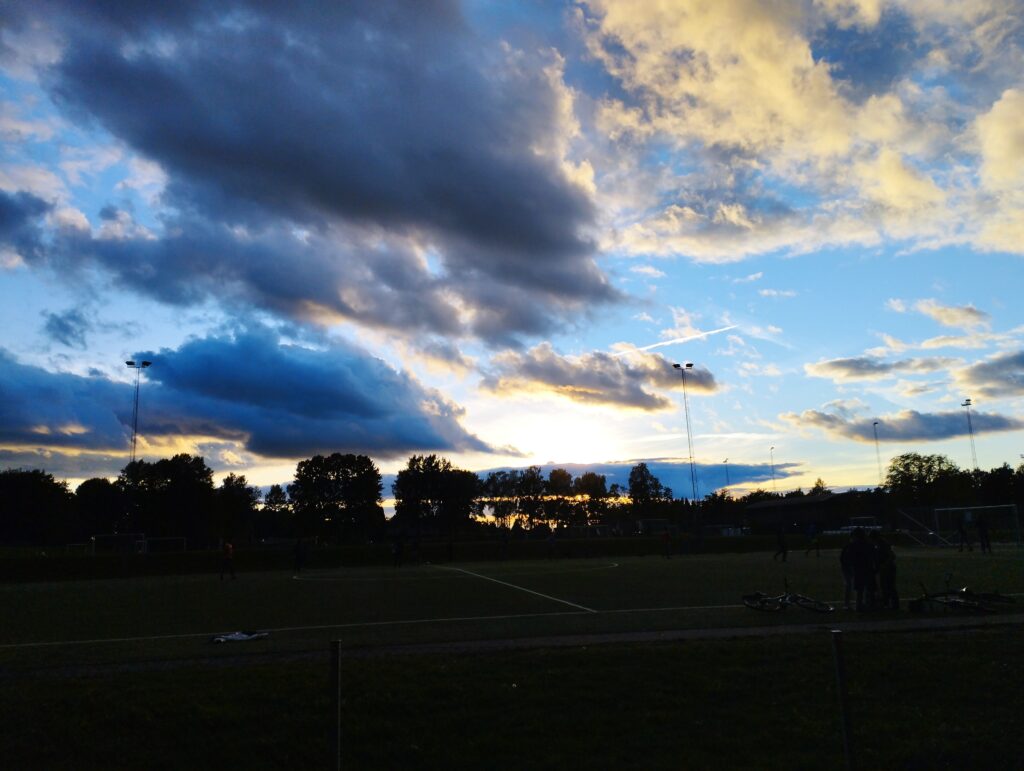
If you’re going for a walk at night, you’ll be able to witness totally different landscapes in darkness, as much in the city as in more natural places.
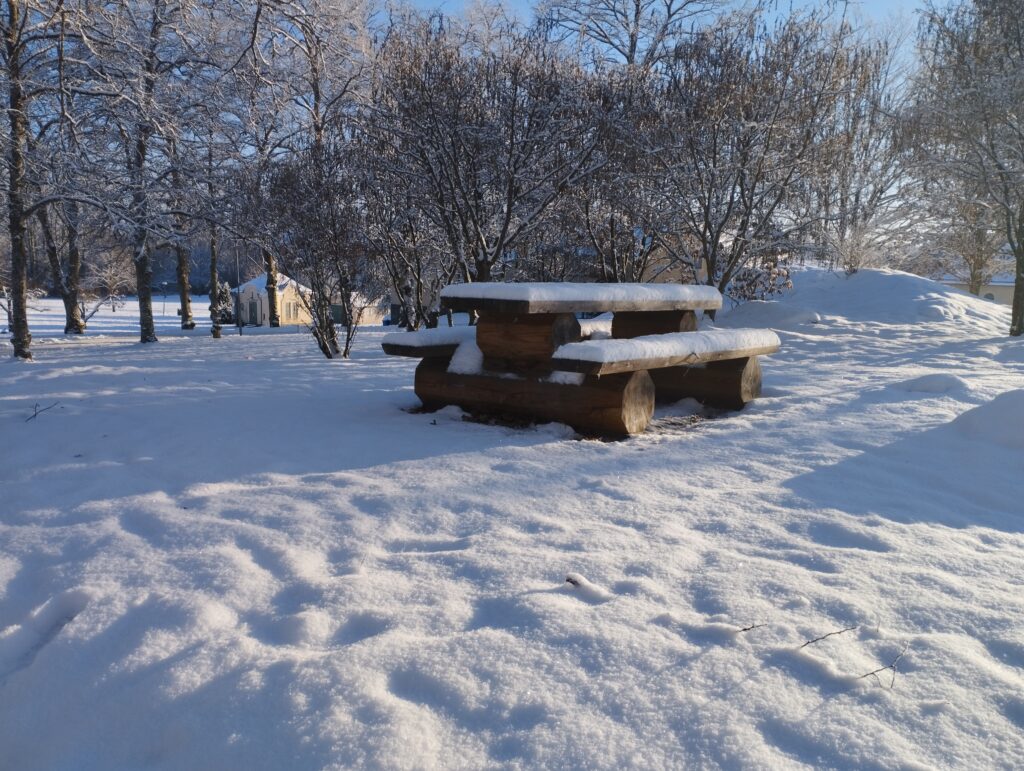
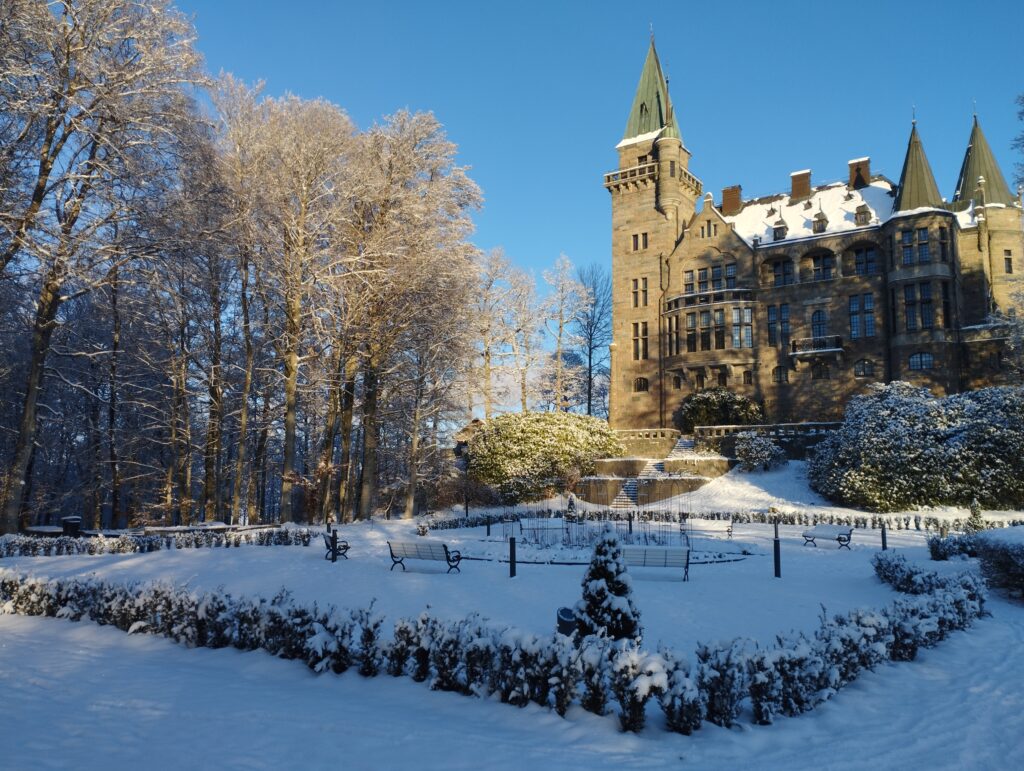
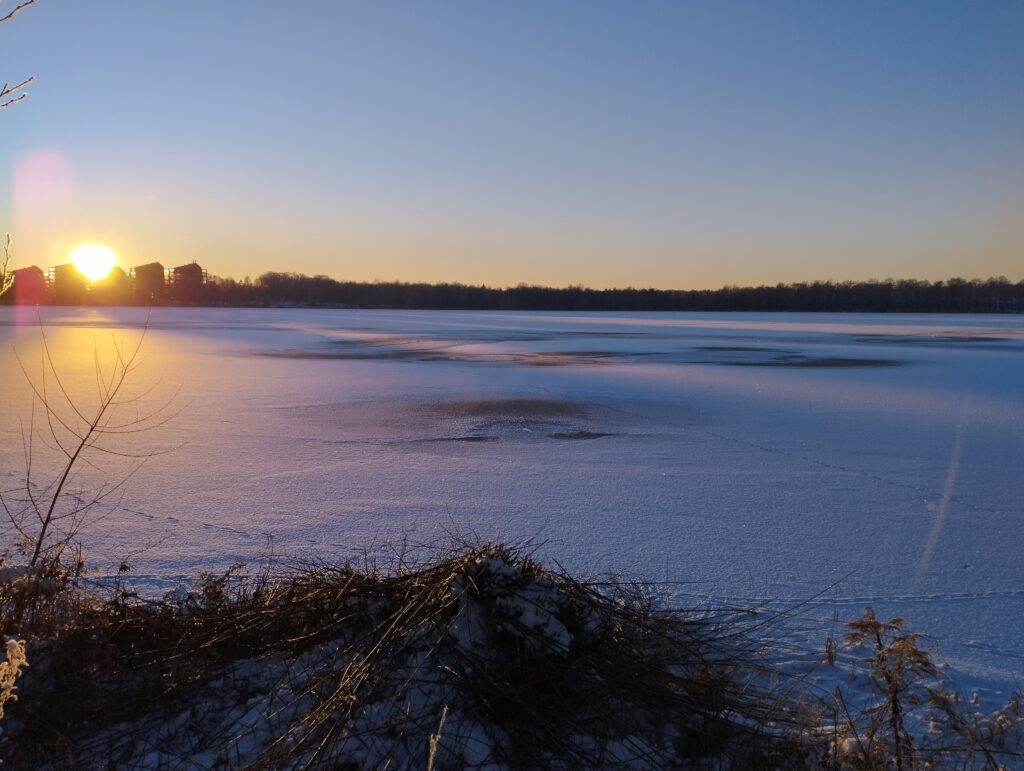
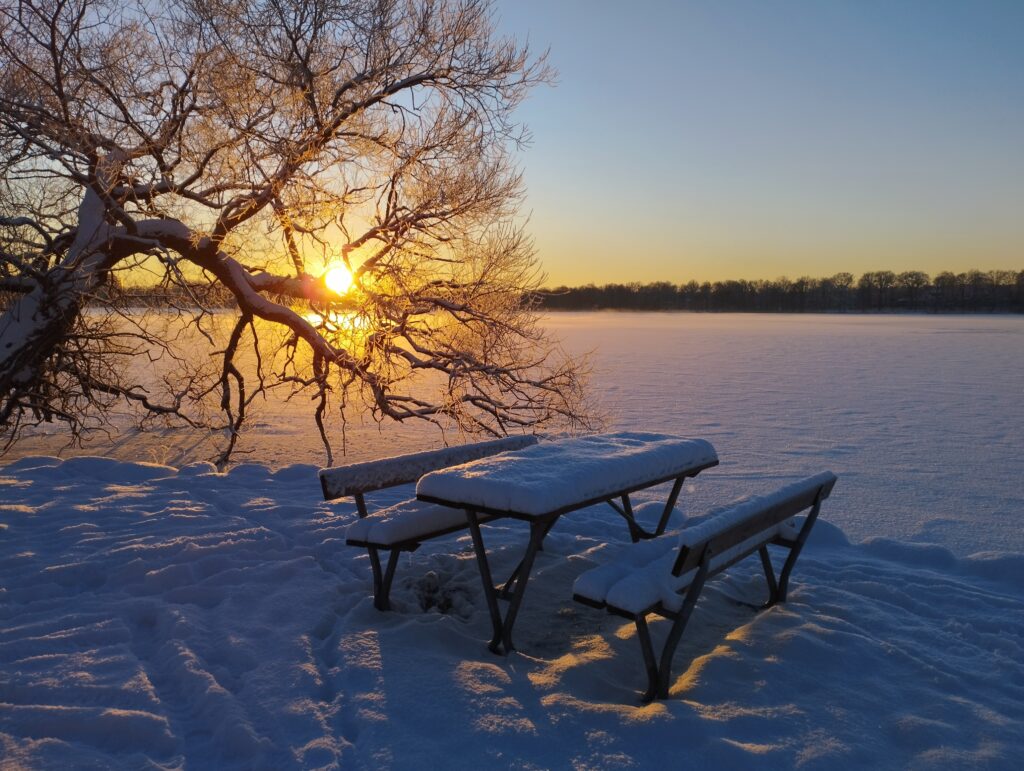
Winter

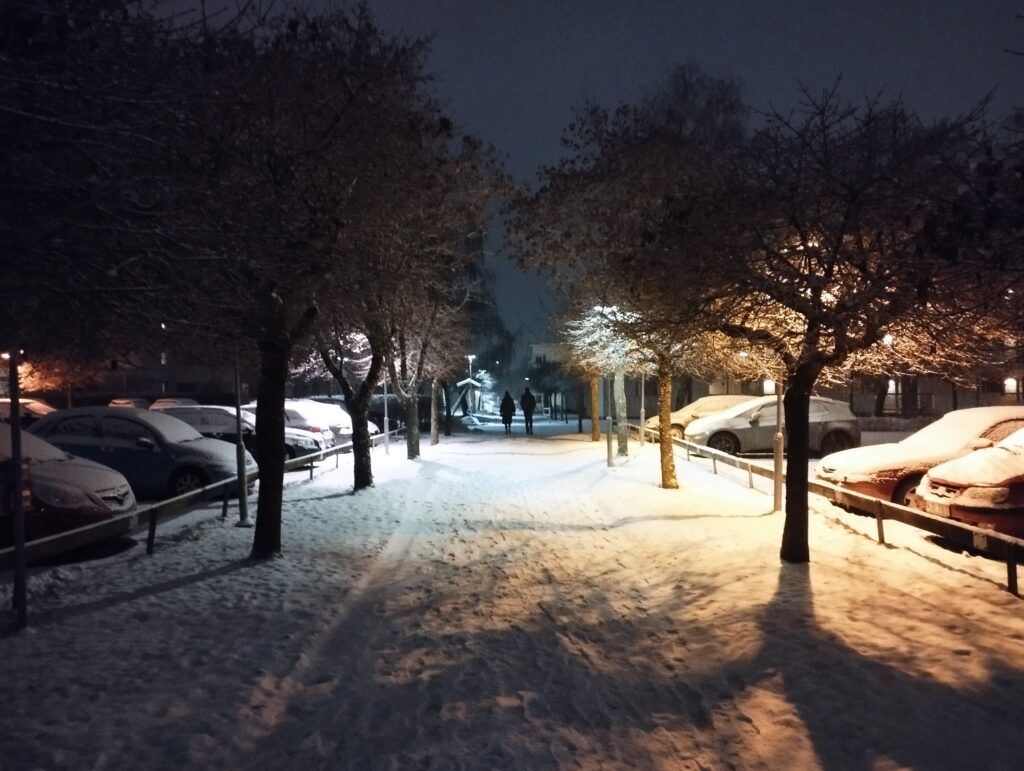
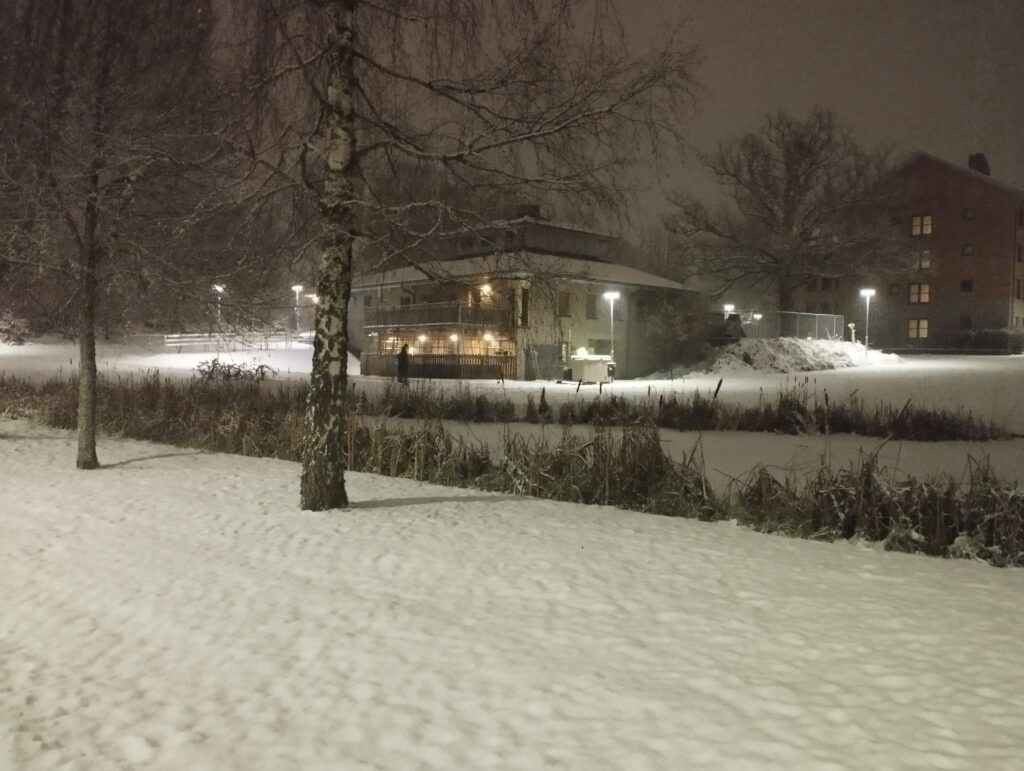
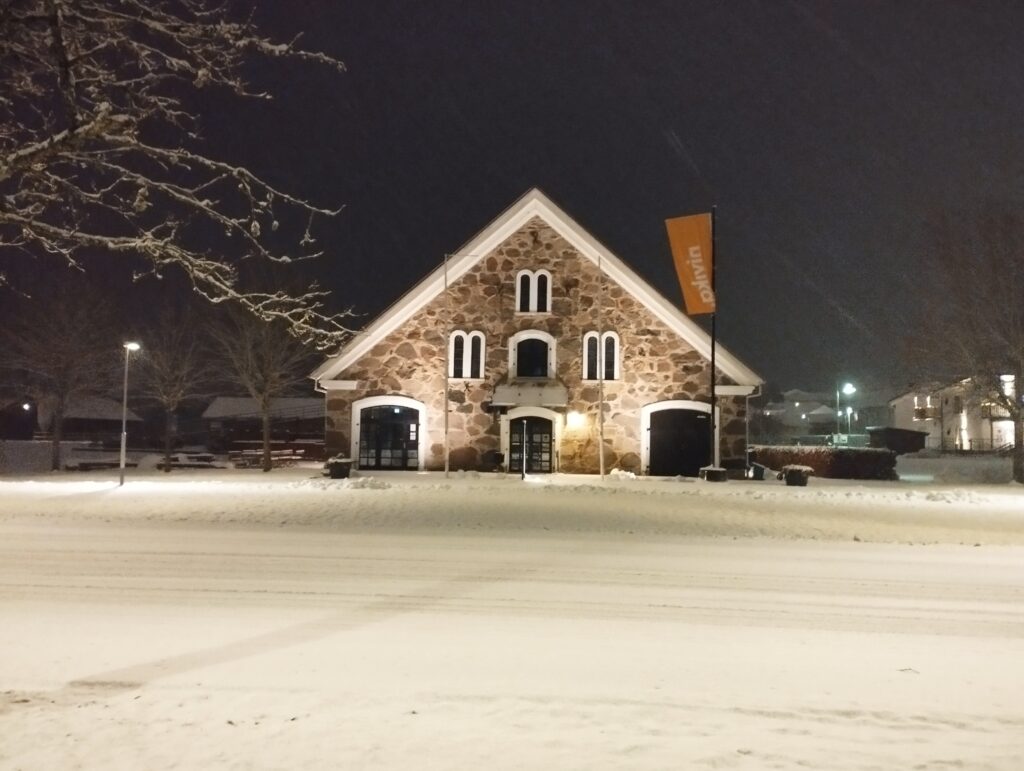
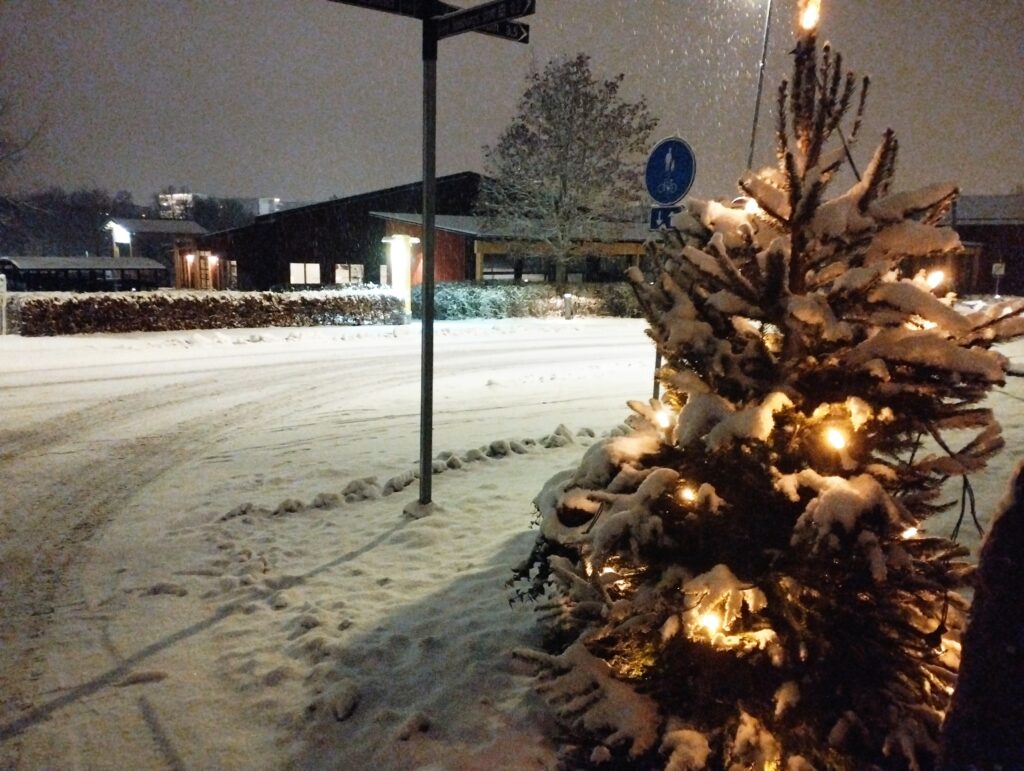
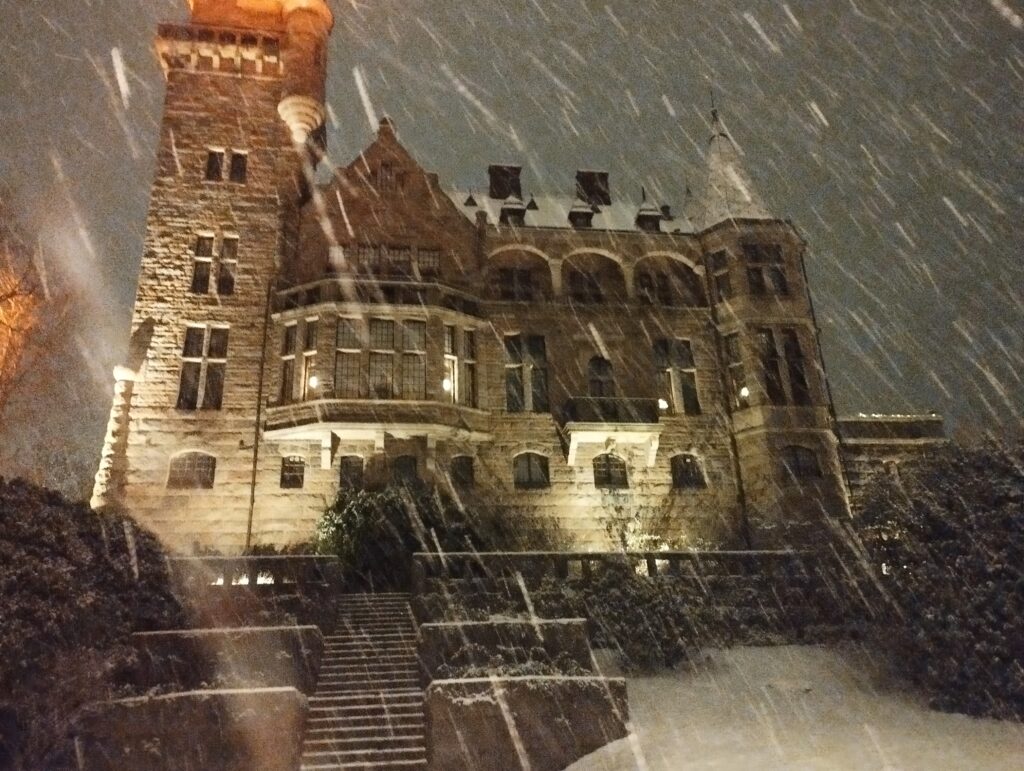
Winter is the toughest season to live in Sweden but is also the one that fits this country best. Under snow, this city suddenly looks totally different. During my stay, temperatures went as low as -15°C, and it’s on this day that I could take among the best pictures. This trip in Sweden taught me that it was not unbearable for me to live in a that cold place, as long as I wear clothes warm enough. The wind being not too strong there, -15°C actually feels warmer (or let’s say, less cold) than I expected !

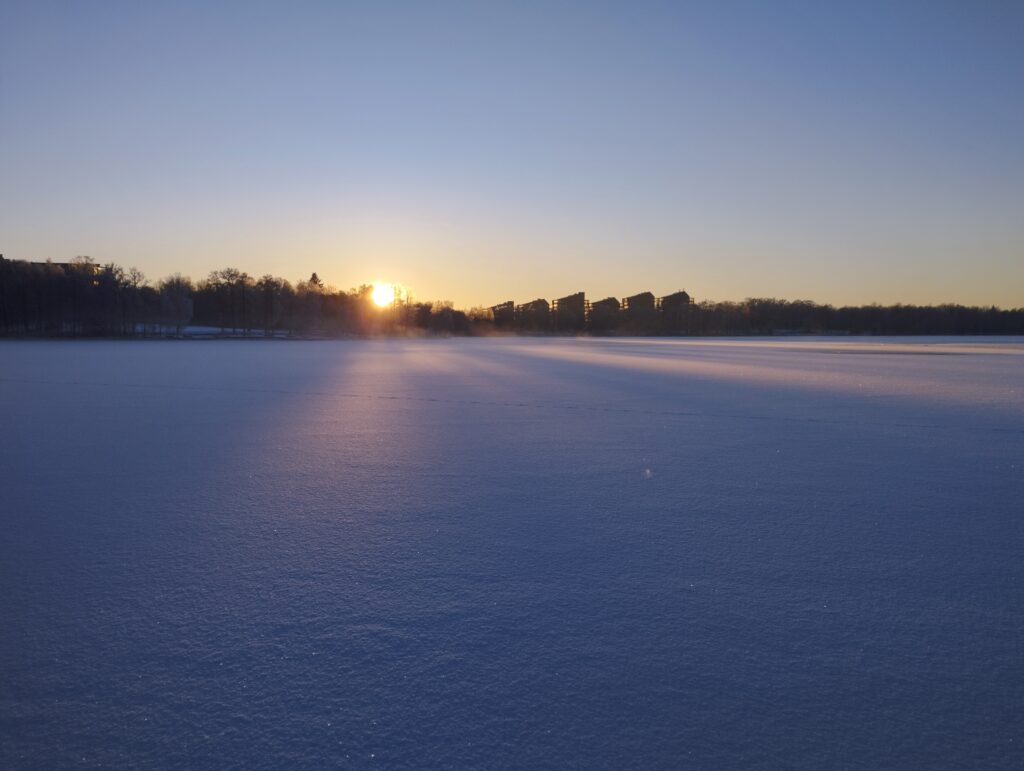
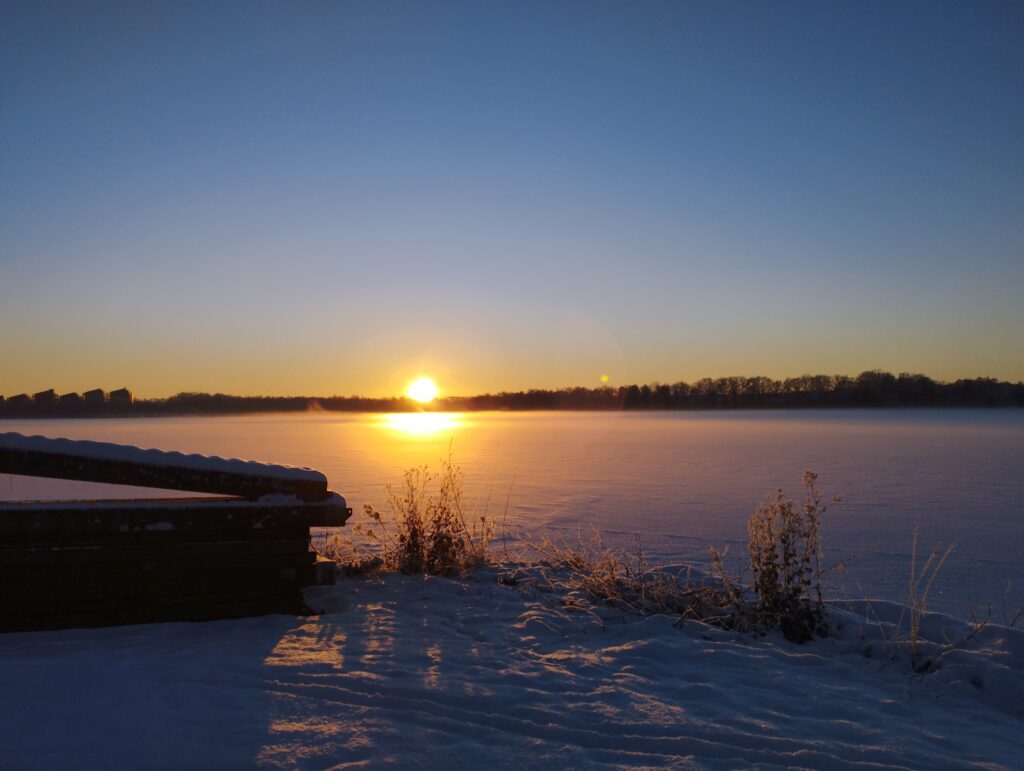
Once again, going for a walk by night can give you a totally different view of the city, this time under beautiful snow and lights.

Courses in Linnaeus University : Information Visualization

Courses in Linnaeus University : Information Visualization

During my exchange semester in Linnaeus University, I’ve had 5 different courses. I’ve particularly liked one of them, so I’ve decided to make a blog post about it, my most favorite course : Information Visualization.

In this course, we had the very basic goal of learning a lot about the different ways to visualize different kinds of information and being able in the end to think about our own representations.

Information visualization can take a very wide range of possibilities and there can be tons of visualizations for a single group of data. The example below shows perfectly the complexity an information display can take.

Fichier:Minard.png — Wikipédia
Charles Minard’s map of Napoleon’s disastrous Russian campaign of 1812

In the above’s map, Charles Minard represented the disastrous Russian invade campaign using six different types of data : the number of Napoleon’s troops, distance, temperature, the latitude and longitude, direction of travel, and location relative to specific dates. He indeed represented all these information in a very original way that might look at first a little bit hard to understand, but once we start to understand a little the map, we can get really quickly the picture out of it.

During this course, we have seen a lot of different visualization techniques like preattentive processing, data transformation using dynamic queries with for example range sliders, view transformations using user interaction with for example zoom and pan, just to cite a few.

At the end of the course, we had to make our own visualization of a specific set of data about cars and their characteristics. Mine was the following :

My visualization for the final project

As we had a lot of different characteristics for each car (26 features in total), I decided to display them using three different types of chart. At first a point chart, then a bar plot and finally a star plot.

The point chart is used to display and compare every cars using the numeric data. It is possible to change the features we are comparing them with using the simple select tools.

The bar plot is used to compare the types of cars and putting them in groups using text data in a way we can easily find what type of car is a specific point on the first chart with the use of colors.

The star plot is used to display every information of a specific car after clicking on it on the point chart. So for example if we feel interested in a car because it looks cheap with a high horsepower, we can also see easily its other statistics in the star plot so we can make up our mind about it. We also can use it to compare a car to others by adding more cars on the plot.

Another important feature of my visualization was preattentive processing. Preattentive processing is what allows us to distinguish data quickly (between 50 and 500ms) thanks to a difference of representation. One of the fastest preattentive processing is when you for example decide to put a blue point on a point chart full of red points. This way, your brain will identify in a very short time the blue point, so it basically makes it easier to find specific information.

To add this on my visualization, it is as simple as clicking on a car type in the bar plot. It will then turn all the car’s point colors in red except for the type clicked on which will be then blue. This way, the user can easily identify where are all the cars with a specific feature (here, car maker : Alfa Romeo). It can be very useful when there are too many car types like in the following example with the car makers.

Visualization without preattentive processing
Visualization with Preattentive processing

I personally liked a lot this course. It was very interesting to learn about all these techniques and it was the one with the most real-life use-cases as it is a course mainly focused on design which is basically everywhere in our lives, with a focus here on information visualization.

Sweden’s Universities and Nations

Sweden’s Universities and Nations

When I arrived in Sweden in the end of August, one of the thing that first surprised me is something called « Nations ».

Sweden’s nations are basically groups of people, that everyone can join but nobody is obliged to, with whom you will be able to do a lot of activities prepared by these, like parties and games. Nations seem to be one of the best way to make friends there, to have a lot of fun and it seems to give people a sense of identity as it looks like to me to be big families.

Before the university’s new year starts, they like a lot to party for one or two weeks to enjoy their summer holidays at the fullest.
One way of doing it is to set tents in a green space and to settle there for the time you plan to party which allows you to have your own area to play. The tents also protect you from rain which comes very often in Sweden.

Nations all have their own dress code, it is mainly about having a specific top and a pant of a certain style and a chosen color by the nation where you can hang badges, so basically everyone wears the same clothes. The more you have badges, the more it means you participated in a lot of activities and you are in this Nation for a long time. A friend of me had a pant litteraly full of badges after 4 years.

These nations can have a very big amount of people in it. The nation from the picture was the biggest of all I’ve seen, and I expect their real number to be even bigger as they might not all be there.
In this picture, they were doing some kind of a competitive activity in groups.

Being a part of a nation also allows them to go to specific events or places, there is for example in Växjö a private club that is only for people among nations.

I personally enjoyed seing them having fun and I like a lot the concept of having a big group to which you belong to and in which you spend a lot of time. Even if I couldn’t join a nation, I fortunately could join the Erasmus group which was kind of similar to a nation. It did not have a specific dress code but still we had a lot of activities which includes night parties a bit like the pictures above and also different sports in the university’s gymnasium.

I wish we had something similar in French universities, I’m sure a lot of people would like to participate in something like this, spending time in a big group you can call family.

Life as an exchange student in Montréal

Life as an exchange student in Montréal

The first two weeks

I recently arrived at Montréal, one of the biggest cities in Canada and more precisely in Québec. Life here is not so different from life in France but still some things differ from what we have in France. The first thing you’re gonna notice is that almost everyone is bilingual. Since Montréal is close to the US border and English being Canada’s official language (Québec is the only province that speaks French) this is not that surprinsing.

Another thing, quite a big one as a French foreigner, is the milk. All forms of milk need to be pasteurized so way less variety of cheese can be produced from it.

Otherwise the city is beautiful, having both huge buildings and colorful parks such as the Mont Royal’s park :

Another thing is that prices can be confusing since taxes (the equivalent of TVA in France) are calculated only at checkout, meaning the price you see on the product is slightly inferior as the price you will pay. Thankfully, since Canadian dollar being less valuable than Euro, we basically have a 25% discount on everything.

Riddles

Riddles

Riddles-Nathanael-and-Audran

After J.R.R. Tolkien (« The Hobbit », chapter 5 Riddles in the Dark)
Riddles by Audran, Damien Da, Damien De, Guillaume, Julien, Ludovic, Nathanaël, Pierre, Raphaël, Sébastien
Page design by Audran & Nathanaël

Spring 2021

The five ages of modern man

The five ages of modern man

Collaborative writing, after William Shakespeare’s famous monologue in « As You Like It », Act II Scene VII

At the beginning, the newborn,
Straight from the artificial incubator center, 
One of the hundreds during the past hour,
Ready to live the same life as the others,
The result of too much porn. 

Then as he finishes his class on his tablet,
His mom wants him to explain Hamlet.
But he prefers playing super hero on Fortnite,
And he dreams of becoming a knight.

And then comes the teenager.
In his bag, some paper,
Not only to write but to roll joints,
Phone in hand, liking many pics.

And now, the stressed-out adult,
The one who has no time to himself,
Locked in his routine between kids, work, and mistress,
An exhausted one, with no juice left.

And so comes the end of the journey,
With a heart filled with regret
And forgotten memories of a bygone era.
Nothing left to do, nothing left to see,
Except reminisce about what could’ve been.

by Audran, Damien Da, Damien De, Guillaume, Julien, Ludovic, Nathanaël, Pierre, Raphaël, Sébastien
Spring 2021

Grenier à sel

Grenier à sel

In the framework of the EU creative process, Mrs. Carole Rey organized a surprise outing for which she would not tell us the destination.

The departure was made from CERI at 2:17 pm, we took the bus C3 towards the city center of Avignon, all this while ignoring the destination. After 15 minutes of walking, we arrived at the « Grenier à sel » of Avignon. This is one of the oldest buildings in Avignon, it was built in the 14th century, about the same time as the Popes’ Palace! Formerly a salt store, it was sold after the revolution as a national property to private individuals.

During our visit, the guide explained the history of this place. The granary has been renovated and is now used as an exhibition center. 

The theme of the current exhibition is abstract art. 

In the first room that we visited we were able to watch a documentary about the making of a film about Pablo Picasso, this video aims to try to explain how this painter thinks and how he creates works. Also, we saw a video of an artist painting on hot stone with water. His drawing was quickly erased due to the heat, so the artist had to start his work over and over again.

In the next room, we could see works that used artificial intelligence to design them (partially or totally), here an example of work made with the cooperation of two artists and an artificial intelligence (each participant has a predefined color).

Finally, in the third room, we could admire a work combining video-projection and drawing. The superposition of these 2 techniques was superb.

Moreover, this room also had works made of origami that need to be filmed with a specific application to see them animated. The sequence of these animations told a story of a couple.

At the very end of our visit, we had the opportunity to create an abstract painting as a group that contained randomly generated patterns by the computer in green color. The pink and orange colors were made by us. The whole group participated in this beautiful piece of art.

https://legrenierasel-avignon.fr/